2013issue C1314-22
Restore volume balance before adding another price-time indicator
Retail charting software commonly ships with 70 to more than 100 built-in indicators, and about 75% to 80% of them are price-and-time formulas. Editorial view: a usable short-term setup starts by restoring quantity as a control signal rather than stacking more oscillators.
- Retail charting software commonly ships with 70 to more than 100 built-in indicators, far more than a trader will use regularly.
- About 75% to 80% of available indicators are price-and-time formulas, versus about 20% to 25% that are quantity-and-time formulas, which biases retail platforms toward price analysis.
- More than 80% of market activity is controlled by the lower five of nine participant groups, activity that is seldom visible in price-and-time indicators alone.
- Volume at price can compare buyer versus seller dominance at each level, and volume Rate of Change is used to flag reversals, balance, and exhaustion before price turns.
A catalog larger than the working set
Retail charting software commonly ships with 70 to more than 100 built-in indicators, far more than a trader will use regularly. Editorial view: the extra menu items are easy to treat as a shortage of oscillators. The working problem is that the catalog overweights price versus time and underweights quantity.
Price, time, and quantity
Every chart indicator is built from at least two of the three primary series, price, time, and quantity, and only a few combine all three. About 75% to 80% of available indicators are price-and-time formulas, versus about 20% to 25% that are quantity-and-time formulas, which biases retail platforms toward price analysis.
Why the first tools still fill the menu
Many widely used indicators were written decades earlier for a different market structure and were among the first tools ported into retail charting systems in the 1990s.
Nine participant groups
Nine market-participant groups enter and exit at different stages of a trend and change how price and volume behave. More than 80% of market activity is controlled by the lower five participant groups, activity that is seldom visible in price-and-time indicators alone.
Volume-price analysis, On-balance volume, and Rate of Change
Volume at price can be color-coded to compare buyer versus seller dominance at each price level. Volume Rate of Change is presented as a way to flag trend reversals, tops, bottoms, and sudden sentiment shifts before price turns. Editorial view: those two readings, together with On-balance volume, put quantity back in as the control signal instead of adding another price-time oscillator.
Balance and exhaustion in volume Rate of Change
Horizontal, softer waves in volume Rate of Change are described as buy-side and sell-side volume nearly in balance, forming consolidations. An upward spike in that range is treated as upside volume exhaustion.
What belongs at the front of the platform
The historical argument is that platforms should emphasize quantity-and-time and price-time-quantity indicators over predominantly price-and-time tools. New indicators should be tested for nuances, convergences, divergences, and extreme patterns.
IBM daily volume rate of change, October 2011 to March 2012
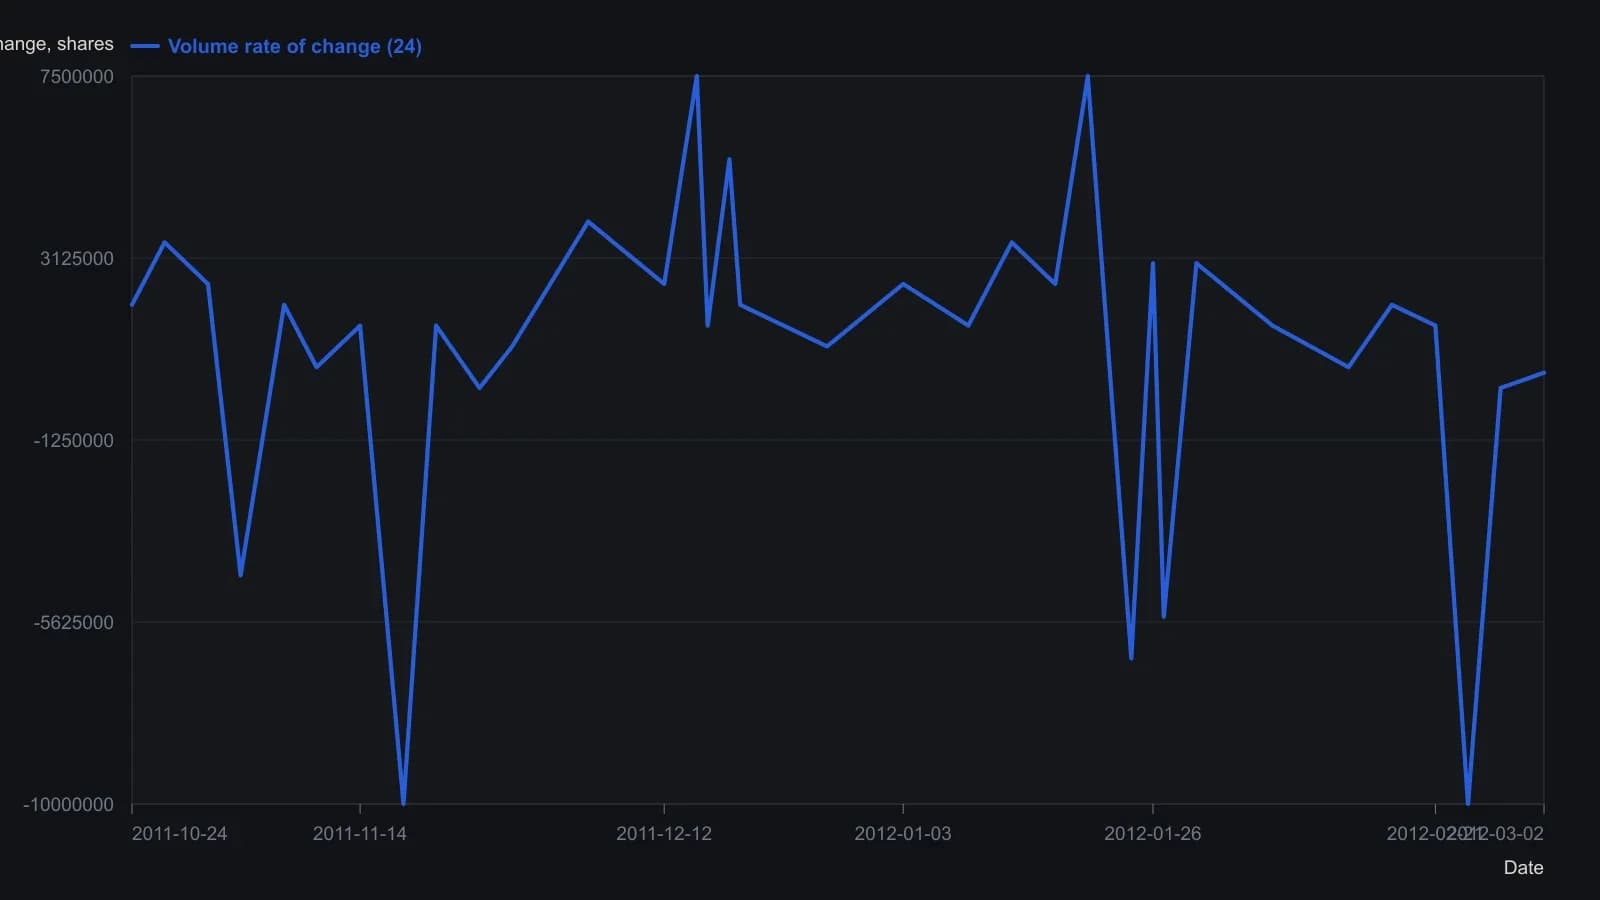
The source fixes a 24-period volume rate of change on daily IBM bars. Digitized points are rounded to the nearest half-million shares; only the final print is exact.
All readings on this track · 46 readings
- 1985Constructing excess and momentum difference-curve oscillators
- 1988Five reading rules for smoothed indicator charts
- 1989Momentum overlays that speed moving-average oscillators
- 1990A laboratory template that constructs Rate of Change as a pane module
- 1991Volume-scaled rate of change as a momentum construction
- 1991Three-indicator market overview from tape, sentiment and rates
- 1991Three-component trend model with rate-of-change filters
- 1992A KST oscillator from a weighted rate-of-change stack
- 1992Four-window weighted rate-of-change composite
- 1992Constructing multi-span smoothed rate-of-change filters
- 1992Constructing a four-horizon summed rate of change
- 1992Constructing KST from four weighted smoothed rates of change
- 1992Constructing a composite from weighted smoothed rates of change
- 1992Three-horizon KST maturity alignment
- 1992Construct a bond-led dividend-to-bond-yield regime first
- 1992Constructing relative-strength KST from weighted rate-of-change
- 1993Constructing a volume oscillator from average ratios and smoothed rate of change
- 1994Gold as a cycle clock for commodities and yields
- 1994Constructing a composite from weighted, smoothed rate-of-change windows
- 1994Constructing gold-mining rate-of-change tripwires for Treasury bonds
- 1994A capacity-stress checklist across commodities, bonds, and breadth
- 1994Rate of change parameters for testable entries
- 1994Constructing rate-of-change midpoints, lookbacks and divergence
- 1994Lead oscillator breaks need price trendline confirmation
- 1994Nested averages for an annual momentum curve
- 1994Evaluating a Coppock-style rate of change as a bottom-regime filter
- 1995A weighted eleven-month Dow rate of change as one testable timing procedure
- 1996Named lookbacks, thresholds, and streaks for entry rules
- 1997A midpoint rate-of-change test for bond trend follow-through
- 1997Constructing a short-rate-adjusted equity momentum filter
- 1998Daily momentum rank-churn as a portfolio-construction problem
- 1999Constructing a lagged rate of change cycle system
- 2000A triple delay line then a one-bar elliptic oscillator
- 2001Confirming rate of change divergences with price
- 2001Momentum trendline breaks need price confirmation
- 2001Market breadth, On-balance volume, and Rate of Change as a combined timing framework
- 2001Know Sure Thing with stacked horizons and trendline confirmation
- 2003Constructing a mechanical system from a rate of change condition
- 2003Constructing momentum from two closes and spotting divergence
- 2003Formula choice tilts which momentum mismatches count as divergences
- 2004RSI and momentum agreement as an asymmetric filter
- 2005Constructing price-normalized moving-slope hybrids
- 2005Unsigned speed gates on a fixed average-cross pair
- 2007Rebuilding rate of change as a path-weighted oscillator
- 2008Construct Special K so short-horizon signals stay inside the primary trend
- 2013Restore volume balance before adding another price-time indicator