1994issue C111-7
Evaluating a Coppock-style rate of change as a bottom-regime filter
Treat a stacked rate of change as a falsifiable bottom-turn procedure. Editorial view: decide whether a confirmed below-zero upturn is a momentum-strategy trigger or a multi-year asset-allocation regime, then run a market-transfer test before trusting the same rule on another national index.
- A Coppock-style curve starts from rates of change versus an adaptation-level, then adds year-scale percentage changes so a rising sequence is read as strengthening momentum.
- The stated buy rule is a below-zero upturn, and the curve is presented as a tool for locating major bottoms rather than tops.
- A confirmed turn can be framed as a momentum strategy or as an asset-allocation regime lasting about two years.
- Editorial view: only after that choice should a market-transfer test ask whether the same formula still behaves as hypothesized when the national market changes.
Start from a rate of change
In this framework an oscillator starts from the percentage change of current price versus a prior price used as the adaptation-level, because percentage change is treated as the relevant return comparison.
A Coppock-style momentum reading is formed by adding several recent year-scale percentage changes so that a rising sequence of those changes is read as strengthening momentum. That stacked reading is the Coppock-style curve: a long-horizon oscillator formed by combining two multi-month percentage changes and smoothing them into one signed series.
How the curve was stacked and smoothed
The original computation used 14-month and 11-month percentage changes on a major US industrial average, added those two rates of change, then applied declining monthly weights from 10 down through 1.
A later computational variant replaced the declining-weight total with an exponential average of monthly average index levels.
The below-zero upturn is the buy rule
The stated buy rule is a change to a positive slope while the oscillator remains below its zero line. That condition is the below-zero upturn: the oscillator is negative and its slope turns from down to up.
The curve is presented as a tool for locating major bottoms rather than tops, with those bottoms often discussed as appearing within about one to two months of the turn.
Because the construction is framed as a reading of mass psychology, it is described as better matched to broad stock-market indices than to individual stocks or funds.
A trade trigger or an allocation regime
A momentum strategy is a complete procedure that turns oscillator slope and zero-line location into entry, exit, or abstention rules and then measures what follows.
One historical evaluation applied monthly average data on a broad US equity index from 1960 through third-quarter 1993 and measured subsequent results at six months, one year, 18 months, and two years after buy signals.
A confirmed below-zero upturn was framed as an asset-allocation regime lasting about two years, and such turns were described as arriving about every three and a half years. Asset allocation here is a regime choice about how large an equity share a portfolio carries after a confirmed bottom turn, rather than a single-trade overlay.
Editorial view: the same below-zero upturn can be scored as a momentum-strategy trigger or as a multi-year equity-allocation regime. Those are different hypotheses and should not be mixed in one test.
Then change the national market
A market-transfer test repeats the same formula on another national index to see whether the bottom rule still behaves as hypothesized.
The same original formula produced a February 1991 bottom-style signal on a UK large-cap index, yet generated multiple false bottom turns during Japan's 1990-92 decline.
Editorial view: run that transfer test only after the rule has been fixed as either a trade trigger or an allocation regime. A signal that appears on one national index and fails on another is evidence about the hypothesis, not a reason to rewrite the rule after the fact.
FTSE 100 CoppockAnnual and the February 1991 below-zero upturn
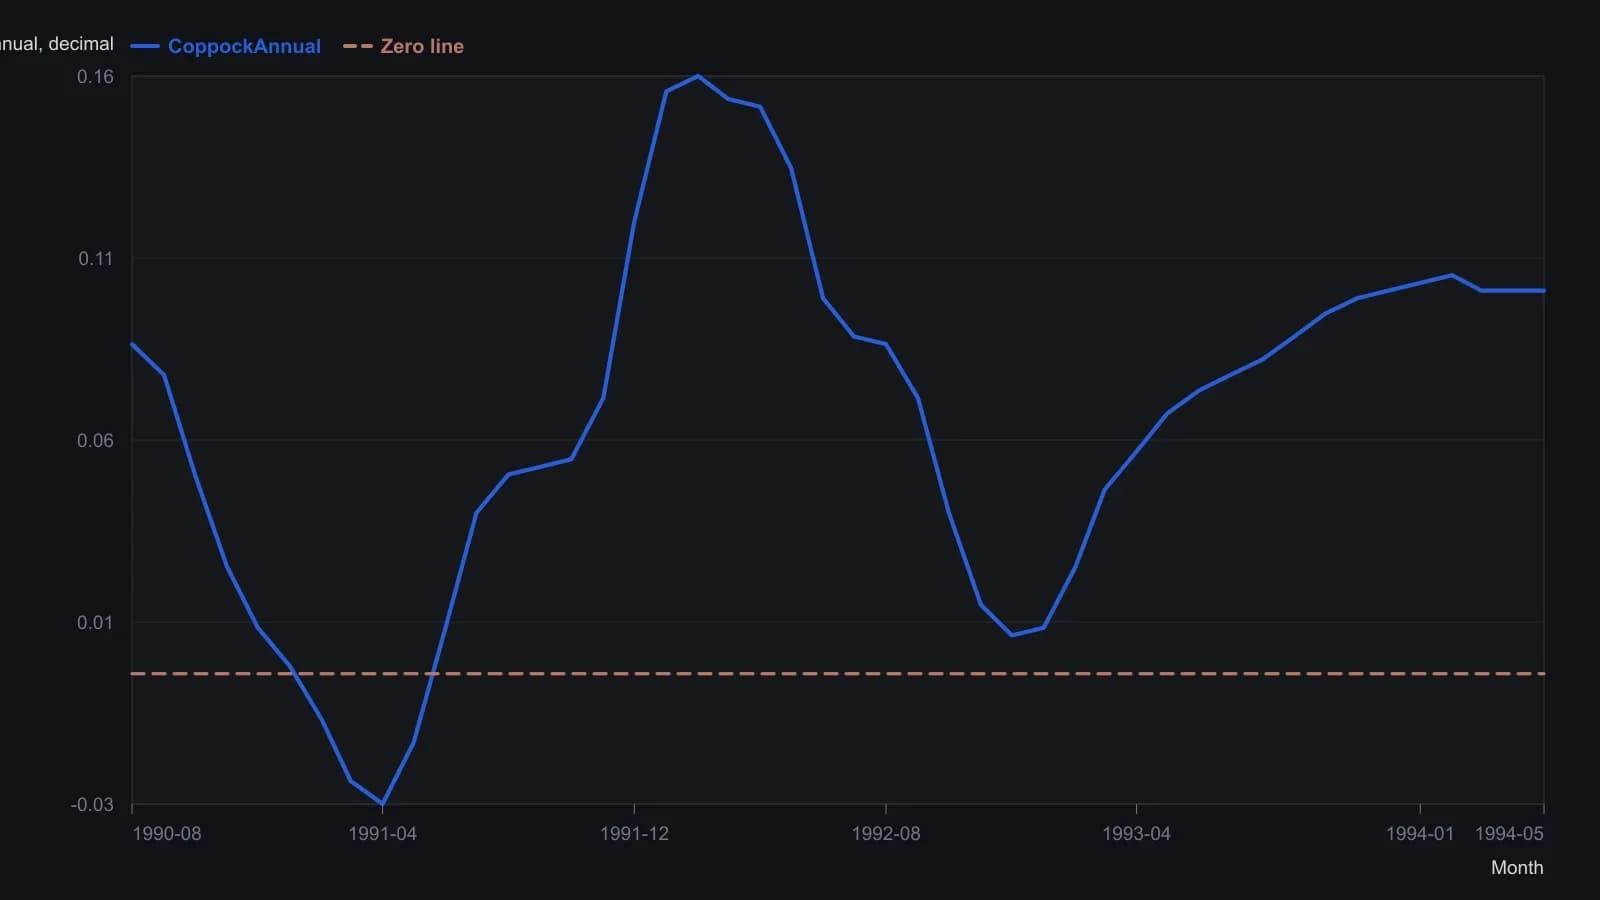
Digitized from the SuperCharts pane. CoppockAnnual is the source's smoothed year-over-year stack, not Coppock's original 14/11 weighted total. The printed quote on 15 August 1994 is 3142.20; the last oscillator print on the pane is 0.0996.
All readings on this track · 46 readings
- 1985Constructing excess and momentum difference-curve oscillators
- 1988Five reading rules for smoothed indicator charts
- 1989Momentum overlays that speed moving-average oscillators
- 1990A laboratory template that constructs Rate of Change as a pane module
- 1991Volume-scaled rate of change as a momentum construction
- 1991Three-indicator market overview from tape, sentiment and rates
- 1991Three-component trend model with rate-of-change filters
- 1992A KST oscillator from a weighted rate-of-change stack
- 1992Four-window weighted rate-of-change composite
- 1992Constructing multi-span smoothed rate-of-change filters
- 1992Constructing a four-horizon summed rate of change
- 1992Constructing KST from four weighted smoothed rates of change
- 1992Constructing a composite from weighted smoothed rates of change
- 1992Three-horizon KST maturity alignment
- 1992Construct a bond-led dividend-to-bond-yield regime first
- 1992Constructing relative-strength KST from weighted rate-of-change
- 1993Constructing a volume oscillator from average ratios and smoothed rate of change
- 1994Gold as a cycle clock for commodities and yields
- 1994Constructing a composite from weighted, smoothed rate-of-change windows
- 1994Constructing gold-mining rate-of-change tripwires for Treasury bonds
- 1994A capacity-stress checklist across commodities, bonds, and breadth
- 1994Rate of change parameters for testable entries
- 1994Constructing rate-of-change midpoints, lookbacks and divergence
- 1994Lead oscillator breaks need price trendline confirmation
- 1994Nested averages for an annual momentum curve
- 1994Evaluating a Coppock-style rate of change as a bottom-regime filter
- 1995A weighted eleven-month Dow rate of change as one testable timing procedure
- 1996Named lookbacks, thresholds, and streaks for entry rules
- 1997A midpoint rate-of-change test for bond trend follow-through
- 1997Constructing a short-rate-adjusted equity momentum filter
- 1998Daily momentum rank-churn as a portfolio-construction problem
- 1999Constructing a lagged rate of change cycle system
- 2000A triple delay line then a one-bar elliptic oscillator
- 2001Confirming rate of change divergences with price
- 2001Momentum trendline breaks need price confirmation
- 2001Market breadth, On-balance volume, and Rate of Change as a combined timing framework
- 2001Know Sure Thing with stacked horizons and trendline confirmation
- 2003Constructing a mechanical system from a rate of change condition
- 2003Constructing momentum from two closes and spotting divergence
- 2003Formula choice tilts which momentum mismatches count as divergences
- 2004RSI and momentum agreement as an asymmetric filter
- 2005Constructing price-normalized moving-slope hybrids
- 2005Unsigned speed gates on a fixed average-cross pair
- 2007Rebuilding rate of change as a path-weighted oscillator
- 2008Construct Special K so short-horizon signals stay inside the primary trend
- 2013Restore volume balance before adding another price-time indicator