1989issue C061-4
Momentum overlays that speed moving-average oscillators
Keep the moving-average oscillator as the smoother, then add a rate-of-change overlay so the rules react to a change in speed instead of waiting for a late cross. Confirmation and stops belong in the same momentum strategy.
- A moving-average oscillator plots the difference between a shorter-period average and a longer-period average of the same market series, and remains smoother than raw price.
- The crossover convention is always in the market, but waiting for a signal-line cross can leave a position exposed during fast adverse swings.
- A rate-of-change overlay on the oscillator tracks a change in speed rather than a change in price direction, and is presented as a faster cue.
- A sensitive oscillator-plus-momentum combination is paired with support-resistance stops and a wait for price confirmation when a trend may outlast the lookback.
The moving-average oscillator as the smoother
A moving-average oscillator is the plotted difference between a shorter-period average and a longer-period average of the same market series. That moving-average oscillator is the histogram of the gap between those two averages of the same series. It tends to rise in advances and fall in declines while remaining smoother than raw price.
The baseline oscillator rule is always in the market. A fast-average cross above the slow average opens a long, and the opposite cross reverses to short. Under that crossover convention, leaving a long implies opening a short, and the reverse.
Why waiting for the signal line leaves a position exposed
That crossover procedure is described as better suited to slow trends and less efficient when the market reverses often. Waiting for the oscillator to cross its signal line can leave a position exposed during fast adverse swings, a problem made worse in markets with daily limits.
A rate-of-change overlay on the oscillator
A rate-of-change overlay on the oscillator is defined as the current oscillator value minus the oscillator value a fixed number of days earlier. It is a speed reading applied to the smoother rather than to raw price. It is presented as a faster cue because it tracks a change in speed rather than a change in price direction.
Under that overlay, rising oscillator momentum is treated as a long cue and falling oscillator momentum as a reverse to short, especially in volatile conditions. That pairing is the momentum strategy: rising overlay values as a long cue and falling overlay values as a reverse to short, optionally with a zero-line variant of the same idea.
Confirmation and support-resistance stops
A very sensitive oscillator-plus-momentum combination is paired with stops at support and resistance, and with a requirement to wait for price confirmation when a trend may outlast the lookback. A lookback mismatch can print a premature turn: a sweep that lasts longer than the overlay window still needs the underlying price to confirm. The support-resistance stop is a hard exit at nearby support or resistance used to bound that sensitive combination.
Keep each calculation visible
Applying one study to another study is preferred to opaque statistical outputs because each calculation, and therefore each failure mode, remains visible.
8-day momentum on gold, mid-1983 to mid-1984
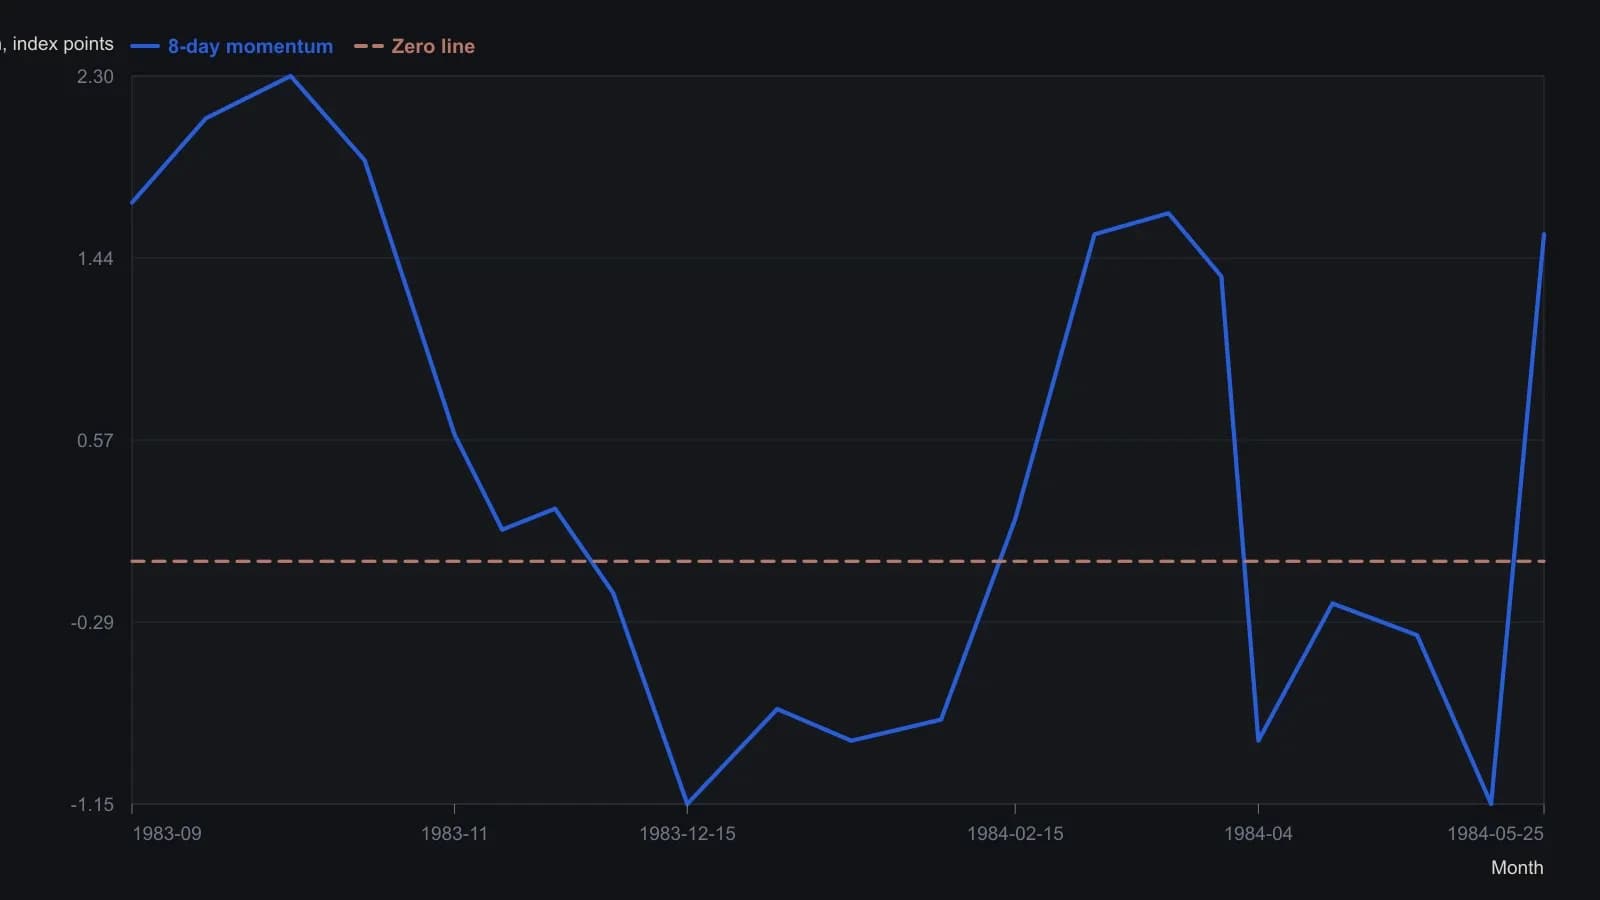
Values are read off the printed CompuTrac figure, so they are approximate. The source fixed an 8-day momentum lookback and treated a zero-line cross as the signal. In long sweeps it warned that momentum can turn early and that the move should be confirmed in price.
All readings on this track · 46 readings
- 1985Constructing excess and momentum difference-curve oscillators
- 1988Five reading rules for smoothed indicator charts
- 1989Momentum overlays that speed moving-average oscillators
- 1990A laboratory template that constructs Rate of Change as a pane module
- 1991Volume-scaled rate of change as a momentum construction
- 1991Three-indicator market overview from tape, sentiment and rates
- 1991Three-component trend model with rate-of-change filters
- 1992A KST oscillator from a weighted rate-of-change stack
- 1992Four-window weighted rate-of-change composite
- 1992Constructing multi-span smoothed rate-of-change filters
- 1992Constructing a four-horizon summed rate of change
- 1992Constructing KST from four weighted smoothed rates of change
- 1992Constructing a composite from weighted smoothed rates of change
- 1992Three-horizon KST maturity alignment
- 1992Construct a bond-led dividend-to-bond-yield regime first
- 1992Constructing relative-strength KST from weighted rate-of-change
- 1993Constructing a volume oscillator from average ratios and smoothed rate of change
- 1994Gold as a cycle clock for commodities and yields
- 1994Constructing a composite from weighted, smoothed rate-of-change windows
- 1994Constructing gold-mining rate-of-change tripwires for Treasury bonds
- 1994A capacity-stress checklist across commodities, bonds, and breadth
- 1994Rate of change parameters for testable entries
- 1994Constructing rate-of-change midpoints, lookbacks and divergence
- 1994Lead oscillator breaks need price trendline confirmation
- 1994Nested averages for an annual momentum curve
- 1994Evaluating a Coppock-style rate of change as a bottom-regime filter
- 1995A weighted eleven-month Dow rate of change as one testable timing procedure
- 1996Named lookbacks, thresholds, and streaks for entry rules
- 1997A midpoint rate-of-change test for bond trend follow-through
- 1997Constructing a short-rate-adjusted equity momentum filter
- 1998Daily momentum rank-churn as a portfolio-construction problem
- 1999Constructing a lagged rate of change cycle system
- 2000A triple delay line then a one-bar elliptic oscillator
- 2001Confirming rate of change divergences with price
- 2001Momentum trendline breaks need price confirmation
- 2001Market breadth, On-balance volume, and Rate of Change as a combined timing framework
- 2001Know Sure Thing with stacked horizons and trendline confirmation
- 2003Constructing a mechanical system from a rate of change condition
- 2003Constructing momentum from two closes and spotting divergence
- 2003Formula choice tilts which momentum mismatches count as divergences
- 2004RSI and momentum agreement as an asymmetric filter
- 2005Constructing price-normalized moving-slope hybrids
- 2005Unsigned speed gates on a fixed average-cross pair
- 2007Rebuilding rate of change as a path-weighted oscillator
- 2008Construct Special K so short-horizon signals stay inside the primary trend
- 2013Restore volume balance before adding another price-time indicator