2003issue C111-2
Constructing momentum from two closes and spotting divergence
Momentum is built as the signed difference between two closes separated by a chosen lookback. Rate of change and the relative strength index measure that change in different ways, and the constructed line is used to locate divergences.
- A simple momentum value is the latest close minus the close from n periods earlier.
- The lookback can use daily, weekly, or five-minute bars and can be lengthened or shortened to change sensitivity.
- Equal price changes leave the momentum line flat, and a smaller latest gain can send the line down while prices are still rising.
- A primary use of the constructed line is to locate divergences, including momentum turning down while prices continue to move up.
Write the two-close difference
A simple momentum value is defined as the latest close minus the close from n periods earlier. Momentum is that signed difference.
The lookback is the number of bars, of any chosen bar size, that separate the two closes. The n-period span may be taken from daily, weekly, or five-minute bars and can be lengthened or shortened to change sensitivity.
When the line stays flat or turns down
Equal price changes over the two compared intervals leave the momentum line flat. A smaller latest gain can send the line down while prices are still rising.
Rate of change and the relative strength index
Rate of change and the relative strength index are listed among oscillator-style tools that measure momentum in different ways. Rate of change is an oscillator-style measure of how much price has changed over a chosen lookback. The relative strength index is a bounded oscillator that condenses ordered price changes over a defined sampling interval.
Locating divergences
A primary use of the constructed line is to locate divergences, including cases where momentum turns down while prices continue to move up. Divergence is a split in which the momentum line and price peaks or troughs fail to confirm each other.
A historical peak comparison
A 12-period momentum series on December crude in summer 2003 was used to compare August indicator peaks with price peaks at the same times.
Extreme readings
An exceptionally low momentum reading was presented as suggesting that near-term downside might be limited and that a bounce could appear before further decline. Extreme high momentum readings, the overbought mark in this workflow, were used to flag markets that may already have moved far even when successive up days still look like a strong trend.
12-period momentum on December 2003 crude oil
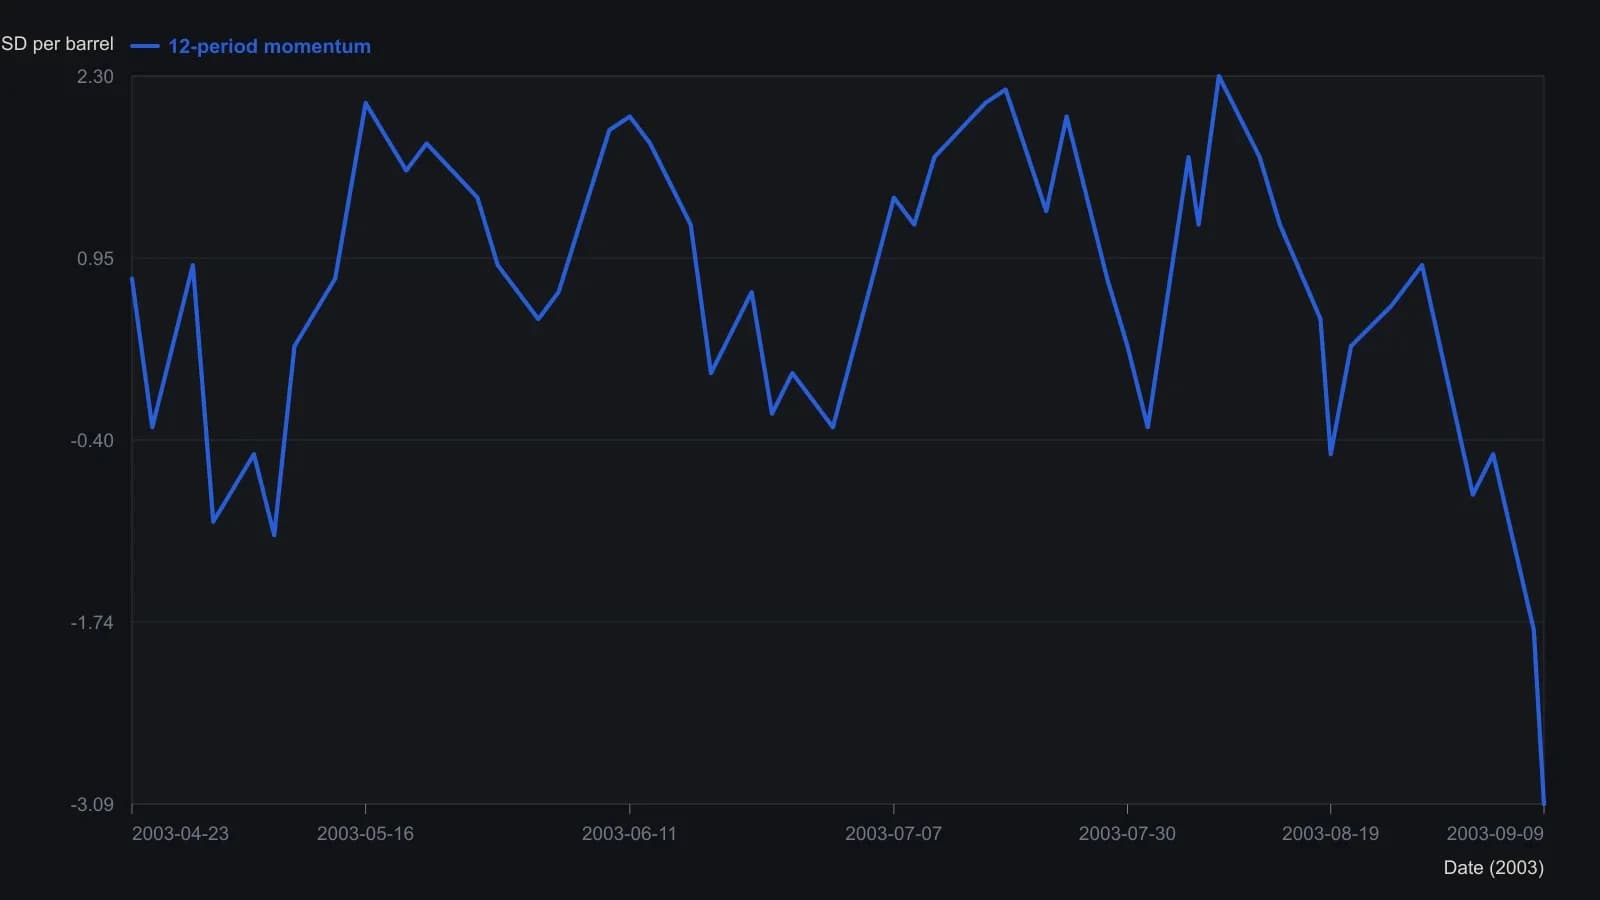
The source fixes the lookback at 12 periods using M = latest close minus the close 12 bars earlier. Dates and readings other than the labeled final print of -3.09 are approximate digitizations from the printed scale (ticks at 0.50).
All readings on this track · 46 readings
- 1985Constructing excess and momentum difference-curve oscillators
- 1988Five reading rules for smoothed indicator charts
- 1989Momentum overlays that speed moving-average oscillators
- 1990A laboratory template that constructs Rate of Change as a pane module
- 1991Volume-scaled rate of change as a momentum construction
- 1991Three-indicator market overview from tape, sentiment and rates
- 1991Three-component trend model with rate-of-change filters
- 1992A KST oscillator from a weighted rate-of-change stack
- 1992Four-window weighted rate-of-change composite
- 1992Constructing multi-span smoothed rate-of-change filters
- 1992Constructing a four-horizon summed rate of change
- 1992Constructing KST from four weighted smoothed rates of change
- 1992Constructing a composite from weighted smoothed rates of change
- 1992Three-horizon KST maturity alignment
- 1992Construct a bond-led dividend-to-bond-yield regime first
- 1992Constructing relative-strength KST from weighted rate-of-change
- 1993Constructing a volume oscillator from average ratios and smoothed rate of change
- 1994Gold as a cycle clock for commodities and yields
- 1994Constructing a composite from weighted, smoothed rate-of-change windows
- 1994Constructing gold-mining rate-of-change tripwires for Treasury bonds
- 1994A capacity-stress checklist across commodities, bonds, and breadth
- 1994Rate of change parameters for testable entries
- 1994Constructing rate-of-change midpoints, lookbacks and divergence
- 1994Lead oscillator breaks need price trendline confirmation
- 1994Nested averages for an annual momentum curve
- 1994Evaluating a Coppock-style rate of change as a bottom-regime filter
- 1995A weighted eleven-month Dow rate of change as one testable timing procedure
- 1996Named lookbacks, thresholds, and streaks for entry rules
- 1997A midpoint rate-of-change test for bond trend follow-through
- 1997Constructing a short-rate-adjusted equity momentum filter
- 1998Daily momentum rank-churn as a portfolio-construction problem
- 1999Constructing a lagged rate of change cycle system
- 2000A triple delay line then a one-bar elliptic oscillator
- 2001Confirming rate of change divergences with price
- 2001Momentum trendline breaks need price confirmation
- 2001Market breadth, On-balance volume, and Rate of Change as a combined timing framework
- 2001Know Sure Thing with stacked horizons and trendline confirmation
- 2003Constructing a mechanical system from a rate of change condition
- 2003Constructing momentum from two closes and spotting divergence
- 2003Formula choice tilts which momentum mismatches count as divergences
- 2004RSI and momentum agreement as an asymmetric filter
- 2005Constructing price-normalized moving-slope hybrids
- 2005Unsigned speed gates on a fixed average-cross pair
- 2007Rebuilding rate of change as a path-weighted oscillator
- 2008Construct Special K so short-horizon signals stay inside the primary trend
- 2013Restore volume balance before adding another price-time indicator