2003issue C121-7
Formula choice tilts which momentum mismatches count as divergences
Percentage and fractional rate-of-change constructions that are linked by a strictly increasing transform agree on divergence verdicts. What remains is arithmetic difference versus fraction, a design choice that systematically tilts top versus bottom mismatches with price and belongs inside one testable procedure.
- Percentage and fractional n-period rate-of-change constructions related by a strictly increasing transform produce the same divergence verdicts versus one another and versus price, so the remaining contrast is arithmetic difference versus fraction.
- Under ordinary market conditions, and more clearly when the lookback is short relative to the swing being compared, Mom is more likely to mismatch price at bottoms while fracMom is more likely to mismatch price at tops.
- A high correlation-coefficient between Mom and fracMom does not imply matching divergence behavior, and except in the constant plus-one or constant minus-one cases neither the coefficient nor its square settles whether the oscillators will agree with price.
- A momentum-strategy that treats every price-oscillator mismatch as interchangeable is misspecified unless the chosen formula, lookback, and expected top-versus-bottom tilt are written into the entry, exit, and abstention rules as one testable procedure.
Two formulas, two mismatch maps
A rate-of-change reading is a lookback comparison of current price to price n periods earlier, expressed as a difference, a ratio, or a percentage. Divergence is a price-indicator mismatch in which successive price highs or lows fail to be confirmed by the same sequence of highs or lows on the oscillator.
Percentage and fractional constructions that are related by a strictly increasing transform of the fractional series produce the same divergence verdicts versus one another and versus price. The construction contrast that remains is arithmetic difference versus fraction.
Where each formula is quicker to disagree with price
The arithmetic construction measures change as a raw increment and the fractional construction measures change as a ratio. At bottoms the fraction needs a larger drop in falling speed before it diverges, while at tops the difference needs a larger drop in rising speed before it diverges.
Under ordinary market conditions, and more clearly when the lookback is short relative to the swing being compared, the arithmetic momentum difference is more likely to mismatch price at bottoms while the fractional construction is more likely to mismatch price at tops.
The tilt is a formula property
The same top-versus-bottom tilt appears when the two constructions are plotted on daily equity and index charts and on a monthly index chart, so the bias is a formula property rather than a single-market artifact.
Descending bottoms have a one-sided constraint
For descending price bottoms, the geometry in which the fractional oscillator diverges while the arithmetic oscillator does not is statistically uncommon. That geometry is mathematically ruled out when the lookback is short relative to the span between bottoms, or still short relative to a larger downtrend that contains both bottoms.
High association is not shared divergence
A high rolling correlation between arithmetic and fractional momentum does not imply matching divergence behavior. The two series can still mismatch each other at bottoms even when that association remains extremely high.
A correlation-coefficient informs divergence identity only in the constant plus-one or constant minus-one cases. Otherwise neither a high nor a low coefficient establishes whether the oscillators will agree or disagree with price, and the squared coefficient inherits the same limitation.
The same split in moving-average filters
The same arithmetic-versus-ratio construction split applies to moving-average trend filters. MACD is the difference between a shorter-period moving average and a longer-period moving average of price. fracMACD is the ratio of a short-period moving average to a longer-period moving average of the same price series. percentMACD is the percentage form of that same short-versus-long comparison.
These encodings of short-versus-long average position can be used both as trend state and as price-divergence signals.
Specify the tilt inside one procedure
A momentum-strategy is a complete trading procedure whose entries, exits, and abstentions rest on a chosen momentum construction and its expected divergence behavior. A strategy that treats every price-oscillator mismatch as interchangeable is misspecified unless the chosen formula, lookback, and expected top-versus-bottom tilt are written into the entry, exit, and abstention rules as one testable procedure.
IBM daily price around the 2000–01 descending bottoms
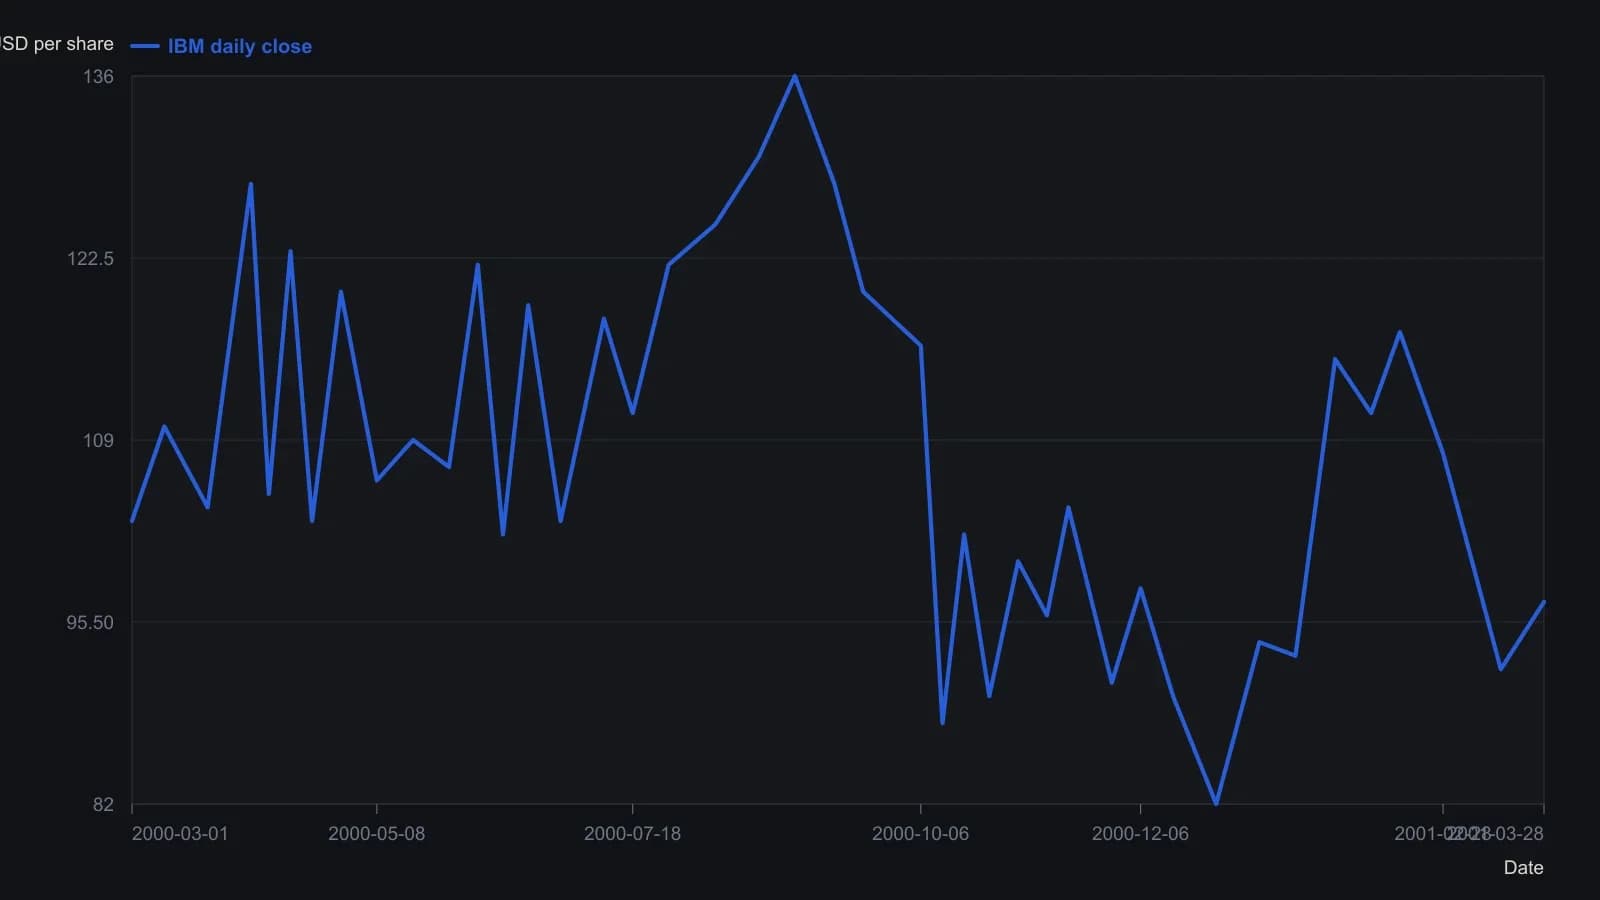
Companion panes on the same figure plot fracMOM(200) and MOM(200), which do not share this price scale, so only the cash series is carried. Y-values are raster readings to the nearest dollar, not exchange prints.
All readings on this track · 46 readings
- 1985Constructing excess and momentum difference-curve oscillators
- 1988Five reading rules for smoothed indicator charts
- 1989Momentum overlays that speed moving-average oscillators
- 1990A laboratory template that constructs Rate of Change as a pane module
- 1991Volume-scaled rate of change as a momentum construction
- 1991Three-indicator market overview from tape, sentiment and rates
- 1991Three-component trend model with rate-of-change filters
- 1992A KST oscillator from a weighted rate-of-change stack
- 1992Four-window weighted rate-of-change composite
- 1992Constructing multi-span smoothed rate-of-change filters
- 1992Constructing a four-horizon summed rate of change
- 1992Constructing KST from four weighted smoothed rates of change
- 1992Constructing a composite from weighted smoothed rates of change
- 1992Three-horizon KST maturity alignment
- 1992Construct a bond-led dividend-to-bond-yield regime first
- 1992Constructing relative-strength KST from weighted rate-of-change
- 1993Constructing a volume oscillator from average ratios and smoothed rate of change
- 1994Gold as a cycle clock for commodities and yields
- 1994Constructing a composite from weighted, smoothed rate-of-change windows
- 1994Constructing gold-mining rate-of-change tripwires for Treasury bonds
- 1994A capacity-stress checklist across commodities, bonds, and breadth
- 1994Rate of change parameters for testable entries
- 1994Constructing rate-of-change midpoints, lookbacks and divergence
- 1994Lead oscillator breaks need price trendline confirmation
- 1994Nested averages for an annual momentum curve
- 1994Evaluating a Coppock-style rate of change as a bottom-regime filter
- 1995A weighted eleven-month Dow rate of change as one testable timing procedure
- 1996Named lookbacks, thresholds, and streaks for entry rules
- 1997A midpoint rate-of-change test for bond trend follow-through
- 1997Constructing a short-rate-adjusted equity momentum filter
- 1998Daily momentum rank-churn as a portfolio-construction problem
- 1999Constructing a lagged rate of change cycle system
- 2000A triple delay line then a one-bar elliptic oscillator
- 2001Confirming rate of change divergences with price
- 2001Momentum trendline breaks need price confirmation
- 2001Market breadth, On-balance volume, and Rate of Change as a combined timing framework
- 2001Know Sure Thing with stacked horizons and trendline confirmation
- 2003Constructing a mechanical system from a rate of change condition
- 2003Constructing momentum from two closes and spotting divergence
- 2003Formula choice tilts which momentum mismatches count as divergences
- 2004RSI and momentum agreement as an asymmetric filter
- 2005Constructing price-normalized moving-slope hybrids
- 2005Unsigned speed gates on a fixed average-cross pair
- 2007Rebuilding rate of change as a path-weighted oscillator
- 2008Construct Special K so short-horizon signals stay inside the primary trend
- 2013Restore volume balance before adding another price-time indicator