1988issue C031-5
Five reading rules for smoothed indicator charts
Once indicator data have been smoothed, the line is still unfinished. An explicit reading construction turns the same series into a forecast that can be tested, rather than leaving an unlabeled picture.
- Once a series is smoothed, more than one reading construction can turn the chart into a forecast, and a rule that fits one series is not assumed to be the best rule for another.
- A tail-band-reading treats only the extreme tails as informative, but those bands should not be applied to a sloping series, where a trend-contaminated-extreme looks rare only because it is recent.
- When the raw series slopes, the same high-low logic is applied to the moving-average-residual rather than to the level itself.
- Timing, direction, and size each have a separate construction: an average-crossover-clock, a direction-step-code, and a pace-oscillator.
A smoothed chart is not a finished forecast
Once indicator data have been smoothed, more than one reading construction can turn the chart into a forecast. A rule that fits one series is not assumed to be the best rule for another.
Editorial reading: treat a smoothed indicator as unfinished work. The educational task is not to stare at the line. The task is to attach an explicit construction so the same series becomes a hypothesis that can be tested.
Editorial grouping: five reading constructions can be attached to that series. They are a tail-band-reading, a moving-average-residual, an average-crossover-clock, a direction-step-code, and a pace-oscillator.
A tail-band-reading uses only the extremes
One construction is a tail-band-reading. It ranks the history of the indicator and treats the top 25 percent of prints as unusually high, the bottom 25 percent as unusually low, and the middle 50 percent as carrying no forecast.
A sloping series contaminates the tails
Those same high-low bands should not be applied to an indicator that already trends. The newest observations then sit in the unusual tail simply by being recent.
That print is a trend-contaminated-extreme. It looks rare only because the series already slopes, not because it is unusual relative to its local path.
Shorts-against-box with 25% tail bands, 1967–1968
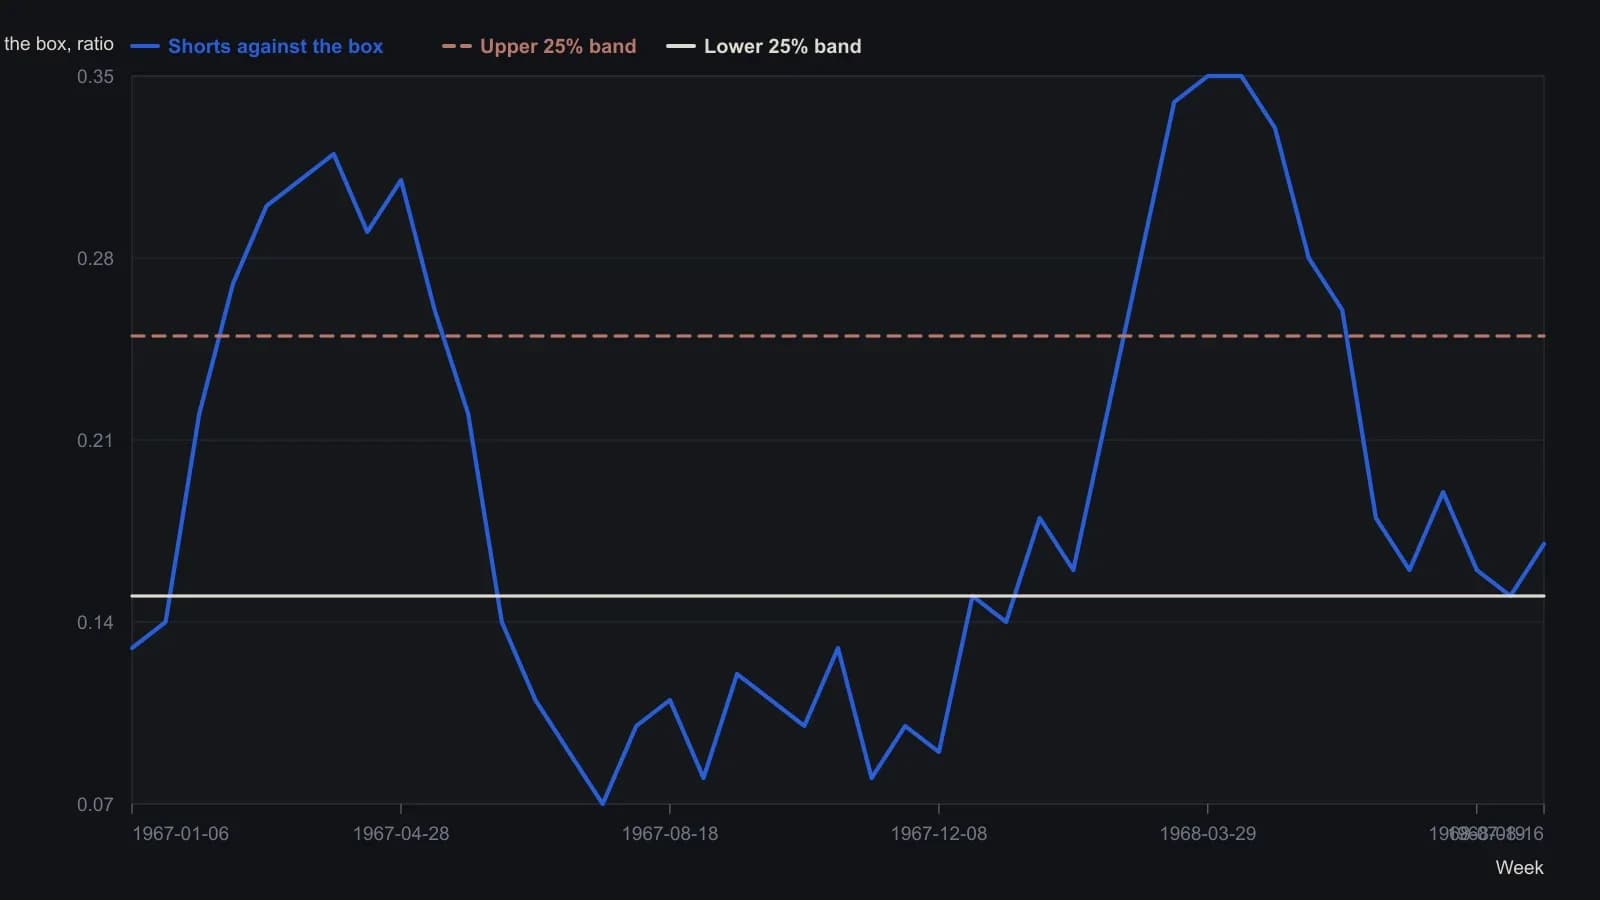
Merrill treats the top and bottom 25% of history as unusually high and low and the middle 50% as no forecast. Quartile lines can be approximated as two-thirds of one standard deviation. Do not use this tail-band reading on a series that itself trends.
A dispersion-shortcut stands in for ranking
A dispersion-shortcut can stand in for a full rank-order percentile count. Plus or minus one standard deviation around the mean is expected to leave about one-sixth of a normal sample above the upper band and one-sixth below the lower band.
Two-thirds of one standard deviation can approximate the 25-percent tails.
Apply the bands to a moving-average-residual
The same high-low band logic can be applied to deviations from a moving average. That gap is the moving-average-residual.
This is the construction used when the raw series itself slopes up or down, so a tail-band-reading can survive the slope.
An average-crossover-clock times the forecast
A forecast can be timed with an average-crossover-clock. The clock can be a sign change through zero, or one moving average crossing another.
One dual-average form compares a 26-week average with a 52-week average.
A direction-step-code stores rise or fall
Direction of movement can be stored as a direction-step-code. The coded array marks a rise, a decline, or no change versus a chosen earlier value, using the integers 2, 1, and 0 respectively.
A pace-oscillator measures size of movement
Size of movement is measured as rate of change, the series velocity or first derivative, sometimes misnamed momentum. That pace-oscillator converts a level into an oscillator.
It may compare the current print with the prior period, or with the same week a year earlier so seasonal effects drop out.
All readings on this track · 46 readings
- 1985Constructing excess and momentum difference-curve oscillators
- 1988Five reading rules for smoothed indicator charts
- 1989Momentum overlays that speed moving-average oscillators
- 1990A laboratory template that constructs Rate of Change as a pane module
- 1991Volume-scaled rate of change as a momentum construction
- 1991Three-indicator market overview from tape, sentiment and rates
- 1991Three-component trend model with rate-of-change filters
- 1992A KST oscillator from a weighted rate-of-change stack
- 1992Four-window weighted rate-of-change composite
- 1992Constructing multi-span smoothed rate-of-change filters
- 1992Constructing a four-horizon summed rate of change
- 1992Constructing KST from four weighted smoothed rates of change
- 1992Constructing a composite from weighted smoothed rates of change
- 1992Three-horizon KST maturity alignment
- 1992Construct a bond-led dividend-to-bond-yield regime first
- 1992Constructing relative-strength KST from weighted rate-of-change
- 1993Constructing a volume oscillator from average ratios and smoothed rate of change
- 1994Gold as a cycle clock for commodities and yields
- 1994Constructing a composite from weighted, smoothed rate-of-change windows
- 1994Constructing gold-mining rate-of-change tripwires for Treasury bonds
- 1994A capacity-stress checklist across commodities, bonds, and breadth
- 1994Rate of change parameters for testable entries
- 1994Constructing rate-of-change midpoints, lookbacks and divergence
- 1994Lead oscillator breaks need price trendline confirmation
- 1994Nested averages for an annual momentum curve
- 1994Evaluating a Coppock-style rate of change as a bottom-regime filter
- 1995A weighted eleven-month Dow rate of change as one testable timing procedure
- 1996Named lookbacks, thresholds, and streaks for entry rules
- 1997A midpoint rate-of-change test for bond trend follow-through
- 1997Constructing a short-rate-adjusted equity momentum filter
- 1998Daily momentum rank-churn as a portfolio-construction problem
- 1999Constructing a lagged rate of change cycle system
- 2000A triple delay line then a one-bar elliptic oscillator
- 2001Confirming rate of change divergences with price
- 2001Momentum trendline breaks need price confirmation
- 2001Market breadth, On-balance volume, and Rate of Change as a combined timing framework
- 2001Know Sure Thing with stacked horizons and trendline confirmation
- 2003Constructing a mechanical system from a rate of change condition
- 2003Constructing momentum from two closes and spotting divergence
- 2003Formula choice tilts which momentum mismatches count as divergences
- 2004RSI and momentum agreement as an asymmetric filter
- 2005Constructing price-normalized moving-slope hybrids
- 2005Unsigned speed gates on a fixed average-cross pair
- 2007Rebuilding rate of change as a path-weighted oscillator
- 2008Construct Special K so short-horizon signals stay inside the primary trend
- 2013Restore volume balance before adding another price-time indicator