1992issue C041-6
Reversing at maximum-adverse-excursion stops after failed entries
Editorial interpretation: treat a stop-loss as a two-sided classroom decision. Maximum adverse excursion first marks where a first-direction trade should be abandoned, then the same threshold is tested as a separately capitalized reverse that shares the original trade horizon.
- In the multi-year add-on sample, winning and losing trades formed distinct maximum-adverse-excursion distributions, and winners generally did not travel far against the position.
- Two winning add-on trades still showed adverse excursion beyond 65 trading points, so a tight loss bound would have abandoned those winners in order to contain the larger group of losers.
- A reverse entered at the maximum-adverse-excursion stop was treated as a separately capitalized risk and closed when the original trade would have closed.
- The reverse-at-stop worksheet for a single year was presented only as a reason to extend the test and improve adverse-excursion estimates, not as statistically reliable evidence.
A two-sided classroom stop
This editorial reading treats a stop-loss as a two-sided classroom decision. Maximum adverse excursion first locates where a first-direction trade should be abandoned. The same threshold is then tested as a separately capitalized reverse if trades that pierce it almost never recover inside the original trade horizon.
Maximum adverse excursion is the largest move against an open position, compared for winners versus losers so a loss bound can sit where most winners remain intact and most runaways are cut. A stop-loss is a pre-committed exit at a chosen adverse-excursion threshold, used both to bound the first trade and to mark a possible reverse.
The first trade and the add-on
The underlying bond procedure defined direction from a 35-day simple moving average of closes and a 17-day average of that average’s daily change. It went long when the one-day change exceeded the trend and short when it did not, with a 700-dollar stop.
An add-on trade is a separately capitalized follow-on entry taken after a short wait if the first trade has not already failed. The add-on rule waited three days after the underlying entry, then entered in the same direction on the fourth day’s open and exited when the underlying trade exited.
The trade horizon is the holding window of the original system trade, which also ends any reverse taken at the stop.
How far winners and losers traveled
In the added multi-year add-on sample, winning and losing trades formed distinct maximum-adverse-excursion distributions, and winners generally did not travel far against the position.
Two winning add-on trades still showed adverse excursion beyond 65 trading points, so a tight loss bound would have abandoned those winners in order to contain the larger group of losers with similar or greater adverse excursion.
Converting the same 49-trade sample into dollars made the winning-versus-losing split sharper: winners stayed within 32 trading points of adverse excursion, while losers reached as far as 97 points the wrong way.
After the stop is hit
Once a maximum-adverse-excursion stop is hit, three paths remain inside the original horizon: a partial bounce that never reaches a winning level, a roughly flat hold until the horizon ends, or continued movement in the original trade’s adverse direction. Editorial interpretation: those three remaining paths are why the same stop can be tested as a reverse rather than only as an exit.
Reversal trading is a same-horizon flip entered when the original trade hits its maximum-adverse-excursion stop and closed when that original trade would have closed. A reverse entered at that stop was treated as a separately capitalized risk, with exposure framed as bounded at the original breakeven because a move back through that level inside the same horizon would have made the first trade a winner.
Losing trades were expected to show a wide remaining adverse range after a stop. A 22-point threshold still left further adverse travel that a same-horizon reverse would try to capture.
Because the intra-day time of each reverse was unknown, adverse-excursion estimates used the day’s high or low as a worst case, so some measured reversals exceeded the original stop even when the close stayed on the loss side of the first trade.
The reverse-at-stop worksheet for a single year was presented only as a reason to extend the test across the remaining years and to improve adverse-excursion estimates, not as statistically reliable evidence.
Net P&L of 1986 reverses entered at the MAE stop
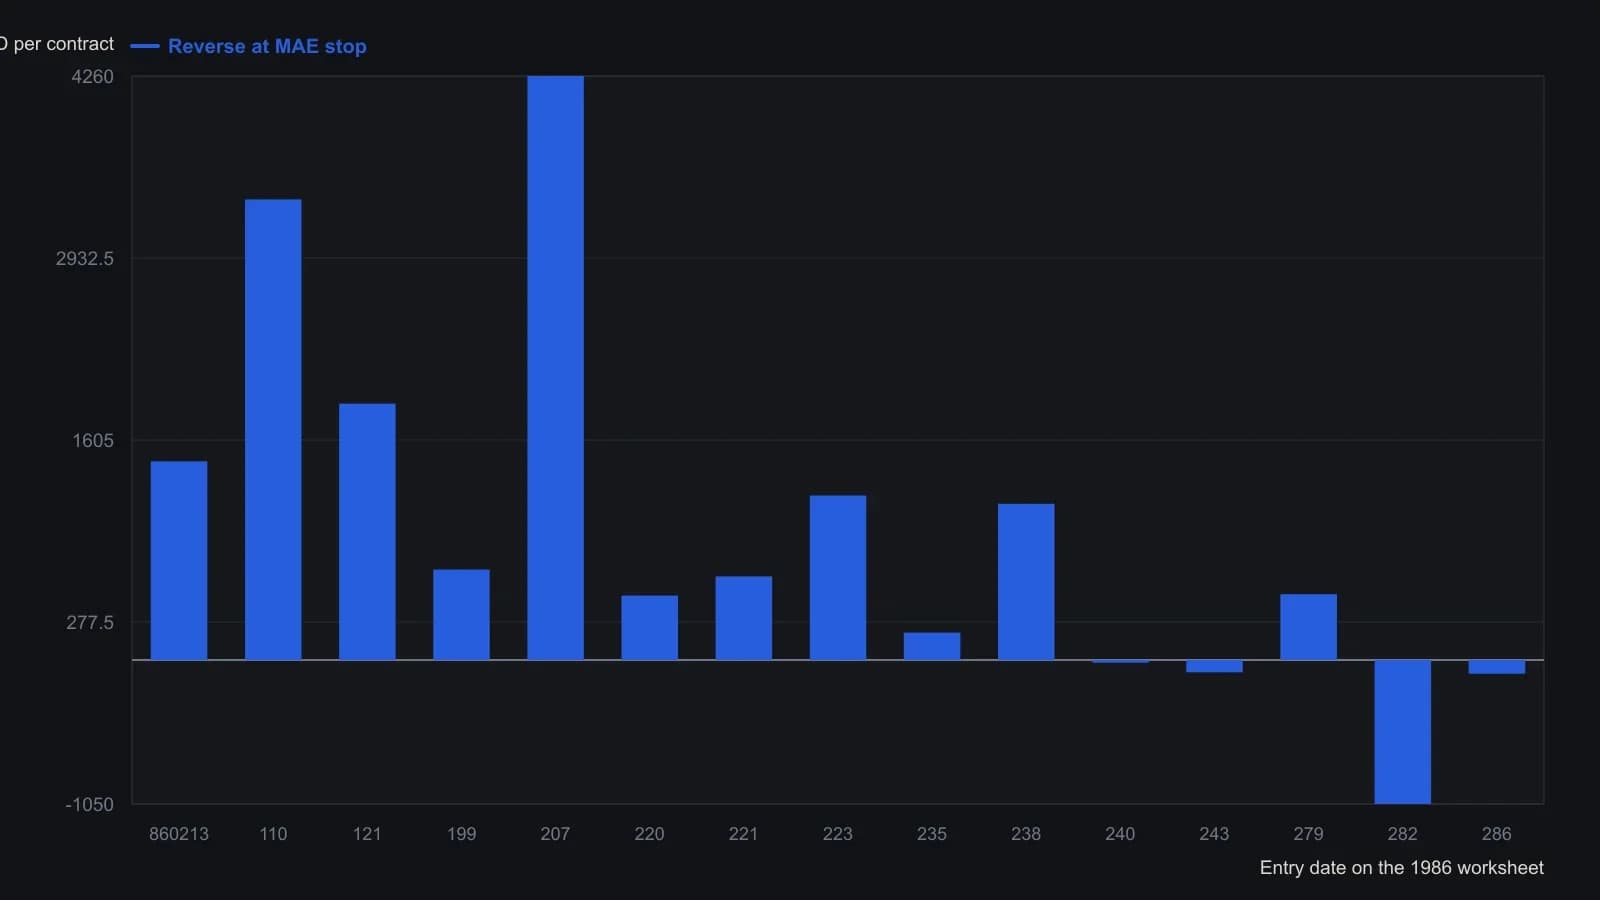
Reverses fire at every MAE stop and exit when the underlying December-bond trade closes. Sweeney ran only 1986 and said more years are needed before the edge is statistically reliable. MAE on the sheet uses that day’s high or low as a conservative stand-in because the reverse fill time is unknown.