1994issue C101-5
Lead oscillator breaks need price trendline confirmation
Oscillator-style series are read as one momentum family. A lead break warns while price structure is still intact, and the archive workflow completes the hypothesis only after a later price confirmation gate such as a trendline break.
- Oscillator-style indicators sit in one momentum family and share the same peak-trough rules, whether the series is jagged or smooth.
- A lead oscillator breakdown or lead oscillator breakout appears while the matching price structure has not yet failed.
- A later price confirmation gate, often a trendline break, is what completes the price-side reversal hypothesis.
- Longer lookbacks carry more horizon weight, and the uncommon lead-break setup is meant to sit inside a weighted consensus.
One momentum family, two textures
Oscillator-style indicators are grouped under one momentum family and are read with the same structural rules, even though some series are smooth and others are jagged.
Rate of change is presented as a jagged rate of change that lends itself to trendline work. A smooth oscillator, such as a slow-turning stochastic, is preferred for direction reversals and moving-average crossovers.
When the oscillator leads price
A lead oscillator breakdown is defined as the oscillator breaking a sequence of rising peaks and troughs while price has not yet broken the corresponding rising structure.
A lead oscillator breakout is defined as the oscillator reversing a sequence of declining peaks and troughs while price continues to decline.
Schematic charts pair lower oscillator lows with higher price lows for the breakdown case, and a new oscillator high against a failed price high for the breakout case.
The price confirmation gate
After a lead oscillator breakdown, the next price advance is treated as likely the last in that specific trend. The price-side hypothesis is completed only by a later price confirmation gate: a trendline break, pattern completion, or moving-average crossover.
Illustrated market charts show a new oscillator low arriving while price still made higher lows, with the later break of the rising price trendline used as the sell-side confirmation. They show a new oscillator high arriving while price failed to make a new high, with the later break of the falling price trendline used as the buy-side confirmation.
S&P 500 after the oscillator lead: rising support then the break
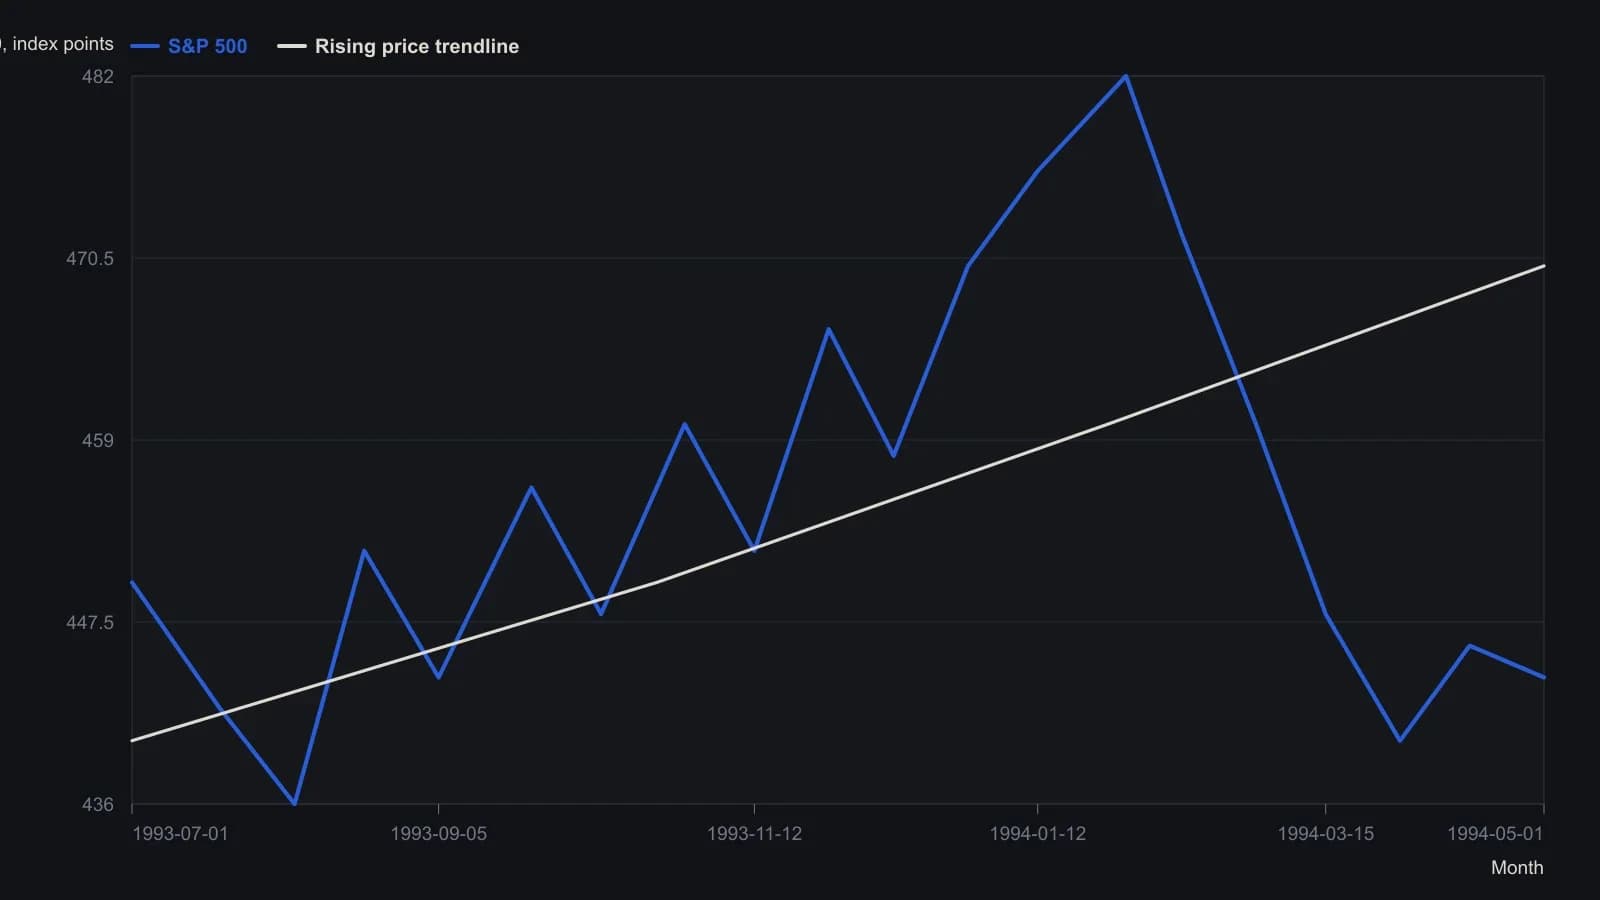
Digitized from the printed daily/weekly line to the nearest few index points. Month ticks on the figure were mapped across mid-1993 to spring 1994. The 0–20 momentum pane is not plotted because it does not share this price axis.
Horizon weight and a weighted consensus
The same lead-lag reading is assigned greater horizon weight when the oscillator is built on a longer horizon, such as a twelve-month rate of change, than when it is built on a short horizon such as a fourteen-day relative strength index.
The lead-break pattern is described as uncommon and incomplete on its own. It is meant to be one input in a weighted consensus of several indicators.
All readings on this track · 46 readings
- 1985Constructing excess and momentum difference-curve oscillators
- 1988Five reading rules for smoothed indicator charts
- 1989Momentum overlays that speed moving-average oscillators
- 1990A laboratory template that constructs Rate of Change as a pane module
- 1991Volume-scaled rate of change as a momentum construction
- 1991Three-indicator market overview from tape, sentiment and rates
- 1991Three-component trend model with rate-of-change filters
- 1992A KST oscillator from a weighted rate-of-change stack
- 1992Four-window weighted rate-of-change composite
- 1992Constructing multi-span smoothed rate-of-change filters
- 1992Constructing a four-horizon summed rate of change
- 1992Constructing KST from four weighted smoothed rates of change
- 1992Constructing a composite from weighted smoothed rates of change
- 1992Three-horizon KST maturity alignment
- 1992Construct a bond-led dividend-to-bond-yield regime first
- 1992Constructing relative-strength KST from weighted rate-of-change
- 1993Constructing a volume oscillator from average ratios and smoothed rate of change
- 1994Gold as a cycle clock for commodities and yields
- 1994Constructing a composite from weighted, smoothed rate-of-change windows
- 1994Constructing gold-mining rate-of-change tripwires for Treasury bonds
- 1994A capacity-stress checklist across commodities, bonds, and breadth
- 1994Rate of change parameters for testable entries
- 1994Constructing rate-of-change midpoints, lookbacks and divergence
- 1994Lead oscillator breaks need price trendline confirmation
- 1994Nested averages for an annual momentum curve
- 1994Evaluating a Coppock-style rate of change as a bottom-regime filter
- 1995A weighted eleven-month Dow rate of change as one testable timing procedure
- 1996Named lookbacks, thresholds, and streaks for entry rules
- 1997A midpoint rate-of-change test for bond trend follow-through
- 1997Constructing a short-rate-adjusted equity momentum filter
- 1998Daily momentum rank-churn as a portfolio-construction problem
- 1999Constructing a lagged rate of change cycle system
- 2000A triple delay line then a one-bar elliptic oscillator
- 2001Confirming rate of change divergences with price
- 2001Momentum trendline breaks need price confirmation
- 2001Market breadth, On-balance volume, and Rate of Change as a combined timing framework
- 2001Know Sure Thing with stacked horizons and trendline confirmation
- 2003Constructing a mechanical system from a rate of change condition
- 2003Constructing momentum from two closes and spotting divergence
- 2003Formula choice tilts which momentum mismatches count as divergences
- 2004RSI and momentum agreement as an asymmetric filter
- 2005Constructing price-normalized moving-slope hybrids
- 2005Unsigned speed gates on a fixed average-cross pair
- 2007Rebuilding rate of change as a path-weighted oscillator
- 2008Construct Special K so short-horizon signals stay inside the primary trend
- 2013Restore volume balance before adding another price-time indicator