1994issue C091-12
A capacity-stress checklist across commodities, bonds, and breadth
The archive framed intermediate-term equities as hospitable while unused capacity lasted and hostile once slack ran down. Editorial reading: place stocks beside industrial prices and bonds, convert that inflation-expectation story into a six-month rate-of-change rule, then require a relative-strength-index confirmation from breadth and utilities before treating a decline as exhausted.
- Intermediate-term equity conditions were framed as hospitable when growth continued with unused capacity and without inflation or deflation pressure, and as hostile once the economy approached full capacity.
- A six-month rate-of-change above 10% in a raw-industrial spot index was a hostile regime for stocks and bonds. A reading below zero was the stated condition that reopened those markets.
- The commodity-equity link reversed over four to eight weeks, so the same industrial impulse could support equities near term while the longer capacity-stress regime stayed hostile.
- A bottom-checklist of commodity change, yield pace, bill stability, and utility relative strength, plus a breadth relative-strength-index, was used to test whether a decline could be treated as exhausted.
From a late-cycle hunch to a checklist
Capacity-stress is a regime in which unused economic slack is shrinking and inflation fear begins to compete with growth. The archive framed intermediate-term equity conditions as most hospitable when growth continues with unused capacity and without inflation or deflation pressure, and as hostile once the economy approaches full capacity.
Editorial: a late-cycle hunch that slack is running out is not a completed read. The archive workflow turns that hunch into a capacity-stress checklist.
Read industrial prices, bonds, and equities together
Intermarket-analysis here means reading industrial prices, bonds, policy, and equities as one inflation-expectation system rather than as isolated charts. Interest rates and equities were said to move together because both respond to inflation expectations, so industrial commodity prices were preferred to a standalone rate series as the shared driver.
Broad advances in industrial materials such as aluminum, copper, palladium, and zinc were treated as evidence that capacity was tightening, a setting in which both equities and bonds were expected to weaken.
Industrial commodities turned up and bonds turned down months before official rate increases, so policy was read as lagging the intermarket inflation sequence rather than causing it.
CRB spot raw industrials, 1988–May 1994
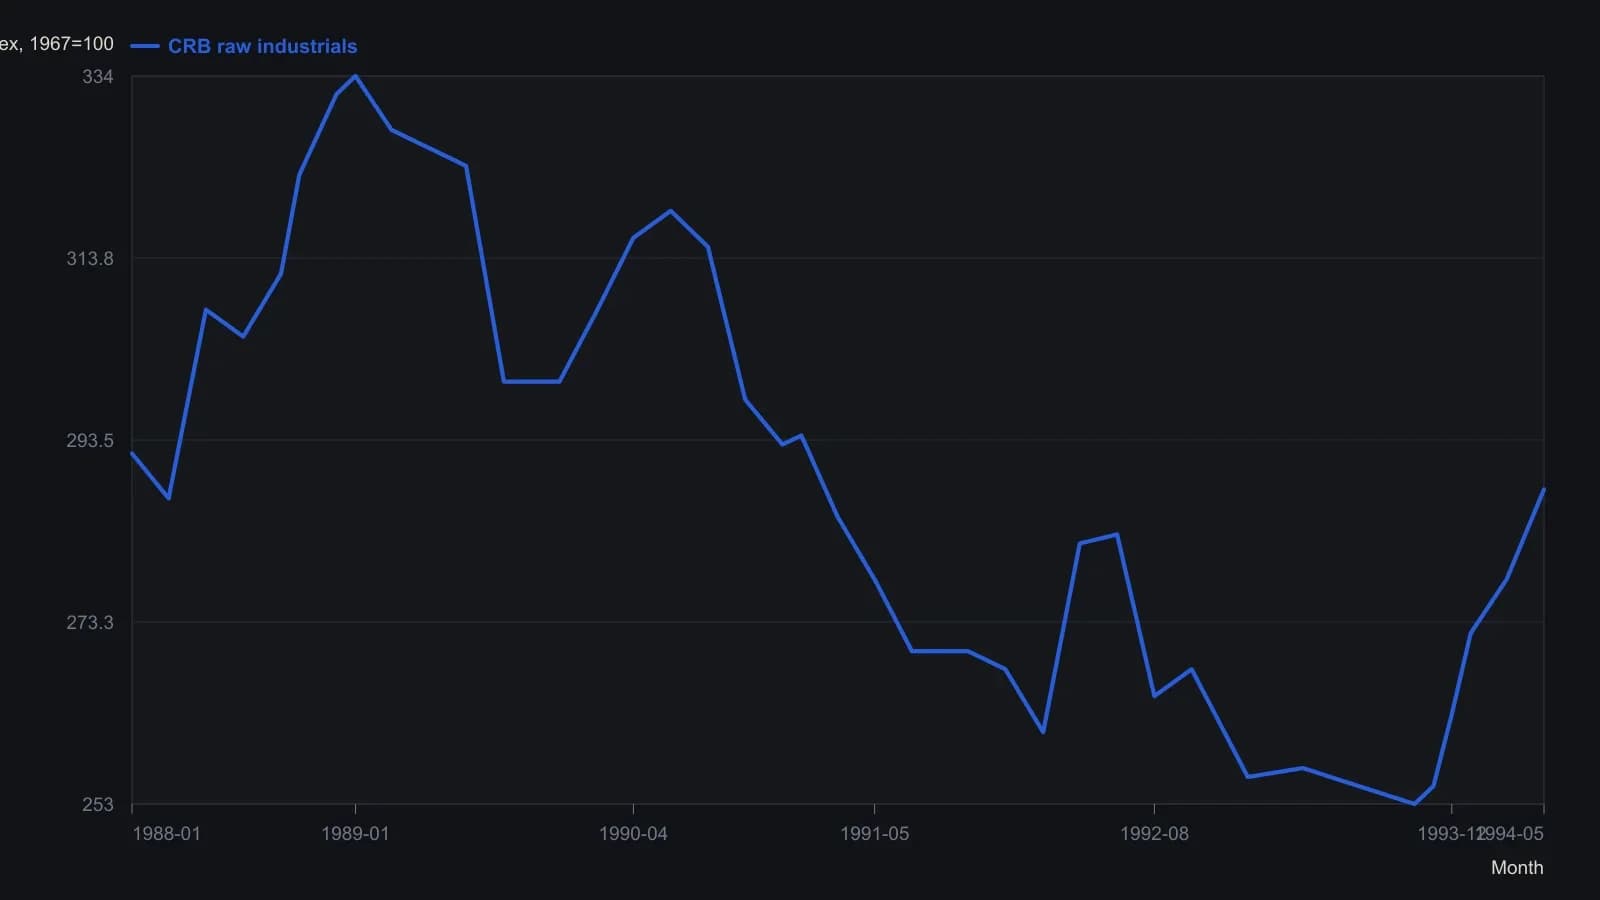
Digitized from the raster to the nearest index point. The May 1994 observation is the printed 288.00 close, not an estimate. Monthly turning points were sampled; the underlying plot is denser.
A six-month rate-of-change marks the hostile regime
Rate-of-change is a percent change over a fixed lookback, applied here to industrial spot prices and high-grade bond yields. A six-month rate-of-change above 10% in a raw-industrial spot index was used as a hostile regime for stocks and bonds. A reading below zero was the stated condition that reopened those markets.
Why a short bounce does not clear capacity-stress
Horizon-split is the observation that the same commodity impulse can support equities over a few weeks while pressuring them over several months. Over a four-to-eight-week horizon the commodity-equity link reversed: rising industrial prices were read as near-term growth and earnings support, and falling prices as near-term pressure.
Editorial: a four-to-eight-week rise in industrial prices can look like support even while the six-month rate-of-change still marks a hostile regime. The horizon-split is why that near-term bounce does not cancel the longer checklist.
Breadth and utilities as confirmation
A short-term relative-strength-index of unweighted listed-stock averages versus capitalization-weighted averages, strongest when the advance-decline line also leads the unweighted series, was used as a breadth forecast. Relative-strength-index is a quantitative comparison of ordered price or breadth series against a stated baseline and lookback.
Editorial: breadth is not a substitute for the six-month industrial rule. It is the later confirmation, joined to the utility relative-strength leg of the bottom-checklist, before a decline is treated as exhausted.
The joint bottom-checklist
A bottom-checklist is a joint set of commodity, yield-pace, bill-stability, and utility relative-strength readings used to test whether capacity-stress has eased. A review of 15 major bottoms since 1956 summarized four joint averages: six-month commodity change slightly below -3%, six-month Aaa yield change of 3%, Treasury-bill yields 5.7% above their six-month low, and S&P utility relative strength 13.5% above its 12-month low.
At the mid-1994 observation those same series sat far from the bottom averages: commodity six-month change above 10%, Aaa yield six-month change near 20%, bills more than 33% above their six-month low, and utilities not yet showing the required relative-strength recovery.
A rare deflation-risk watch
A three-month consecutive decline in nominal M1 was reserved as a rare deflation-risk watch that had not appeared in postwar data. Money-supply tracking was otherwise judged less informative because balances sat outside banks.
All readings on this track · 46 readings
- 1985Constructing excess and momentum difference-curve oscillators
- 1988Five reading rules for smoothed indicator charts
- 1989Momentum overlays that speed moving-average oscillators
- 1990A laboratory template that constructs Rate of Change as a pane module
- 1991Volume-scaled rate of change as a momentum construction
- 1991Three-indicator market overview from tape, sentiment and rates
- 1991Three-component trend model with rate-of-change filters
- 1992A KST oscillator from a weighted rate-of-change stack
- 1992Four-window weighted rate-of-change composite
- 1992Constructing multi-span smoothed rate-of-change filters
- 1992Constructing a four-horizon summed rate of change
- 1992Constructing KST from four weighted smoothed rates of change
- 1992Constructing a composite from weighted smoothed rates of change
- 1992Three-horizon KST maturity alignment
- 1992Construct a bond-led dividend-to-bond-yield regime first
- 1992Constructing relative-strength KST from weighted rate-of-change
- 1993Constructing a volume oscillator from average ratios and smoothed rate of change
- 1994Gold as a cycle clock for commodities and yields
- 1994Constructing a composite from weighted, smoothed rate-of-change windows
- 1994Constructing gold-mining rate-of-change tripwires for Treasury bonds
- 1994A capacity-stress checklist across commodities, bonds, and breadth
- 1994Rate of change parameters for testable entries
- 1994Constructing rate-of-change midpoints, lookbacks and divergence
- 1994Lead oscillator breaks need price trendline confirmation
- 1994Nested averages for an annual momentum curve
- 1994Evaluating a Coppock-style rate of change as a bottom-regime filter
- 1995A weighted eleven-month Dow rate of change as one testable timing procedure
- 1996Named lookbacks, thresholds, and streaks for entry rules
- 1997A midpoint rate-of-change test for bond trend follow-through
- 1997Constructing a short-rate-adjusted equity momentum filter
- 1998Daily momentum rank-churn as a portfolio-construction problem
- 1999Constructing a lagged rate of change cycle system
- 2000A triple delay line then a one-bar elliptic oscillator
- 2001Confirming rate of change divergences with price
- 2001Momentum trendline breaks need price confirmation
- 2001Market breadth, On-balance volume, and Rate of Change as a combined timing framework
- 2001Know Sure Thing with stacked horizons and trendline confirmation
- 2003Constructing a mechanical system from a rate of change condition
- 2003Constructing momentum from two closes and spotting divergence
- 2003Formula choice tilts which momentum mismatches count as divergences
- 2004RSI and momentum agreement as an asymmetric filter
- 2005Constructing price-normalized moving-slope hybrids
- 2005Unsigned speed gates on a fixed average-cross pair
- 2007Rebuilding rate of change as a path-weighted oscillator
- 2008Construct Special K so short-horizon signals stay inside the primary trend
- 2013Restore volume balance before adding another price-time indicator