2005issue C021-3
Selling climax holds versus fails
A selling climax is a high-volume washout that can be considered only after a prior decline. Volume-price analysis opens the case, a MACD histogram extreme and price-indicator divergence grade it, and a later break of the climax-day low closes the hypothesis.
- A selling climax can be considered only after a preceding decline, because that downtrend is what allows forced selling to cascade.
- Overwhelming volume is the first prerequisite, but a washout session is not automatic proof that a larger bear phase is over.
- Oscillator positive divergences, MACD-histogram extremes, and bullish reversal candlesticks are listed as ways to grade a suspected climax.
- Climax lows are usually retested, and a later break of the climax-day low is treated as a reason to abandon the immediate reversal hypothesis.
A selling climax needs a prior decline
A selling climax is defined as possible only after a preceding decline, because that downtrend is what allows forced selling to cascade.
It is a high-volume washout session treated as a candidate for seller exhaustion, not as automatic proof that a bear phase is over.
Weak holders may already have been shaken out before a final market low.
Volume as the first prerequisite
Overwhelming volume is treated as a first prerequisite, with climax-session turnover described as able to rival any single day of the prior advance.
Volume-price analysis compares a break or gap to session turnover to judge whether remaining forced selling may already have been spent.
Tools that grade a suspected climax
Listed confirmation tools for a potential climax include oscillator positive divergences, MACD-histogram extremes, and bullish reversal candlesticks such as hammers, engulfing patterns, morning stars, and piercing patterns.
A MACD histogram extreme is a deeply stretched MACD histogram reading used as a severity check on a decline and as a clue that any bounce may be a countertrend reaction rather than a finished reversal.
Price-indicator divergence is a setup in which price makes a weaker low while an oscillator fails to confirm, used as optional confirmation when gaming a washout.
September 2001 in the industrial average
In the September 2001 industrial-average case, four sessions of selling after the reopen preceded a fifth-session washout on September 21.
A 7,10 stochastic showed no positive divergence that day.
An individual-stock case with confirmation
One individual-stock case combined a gap of nearly four points on more than ten-times typical volume, an intraday drop below 27 that closed near 28, a short-term 7,10 stochastic positive divergence, and a downside MACD-histogram extreme.
Lifepoint Hospitals: mid-August selling climax holds
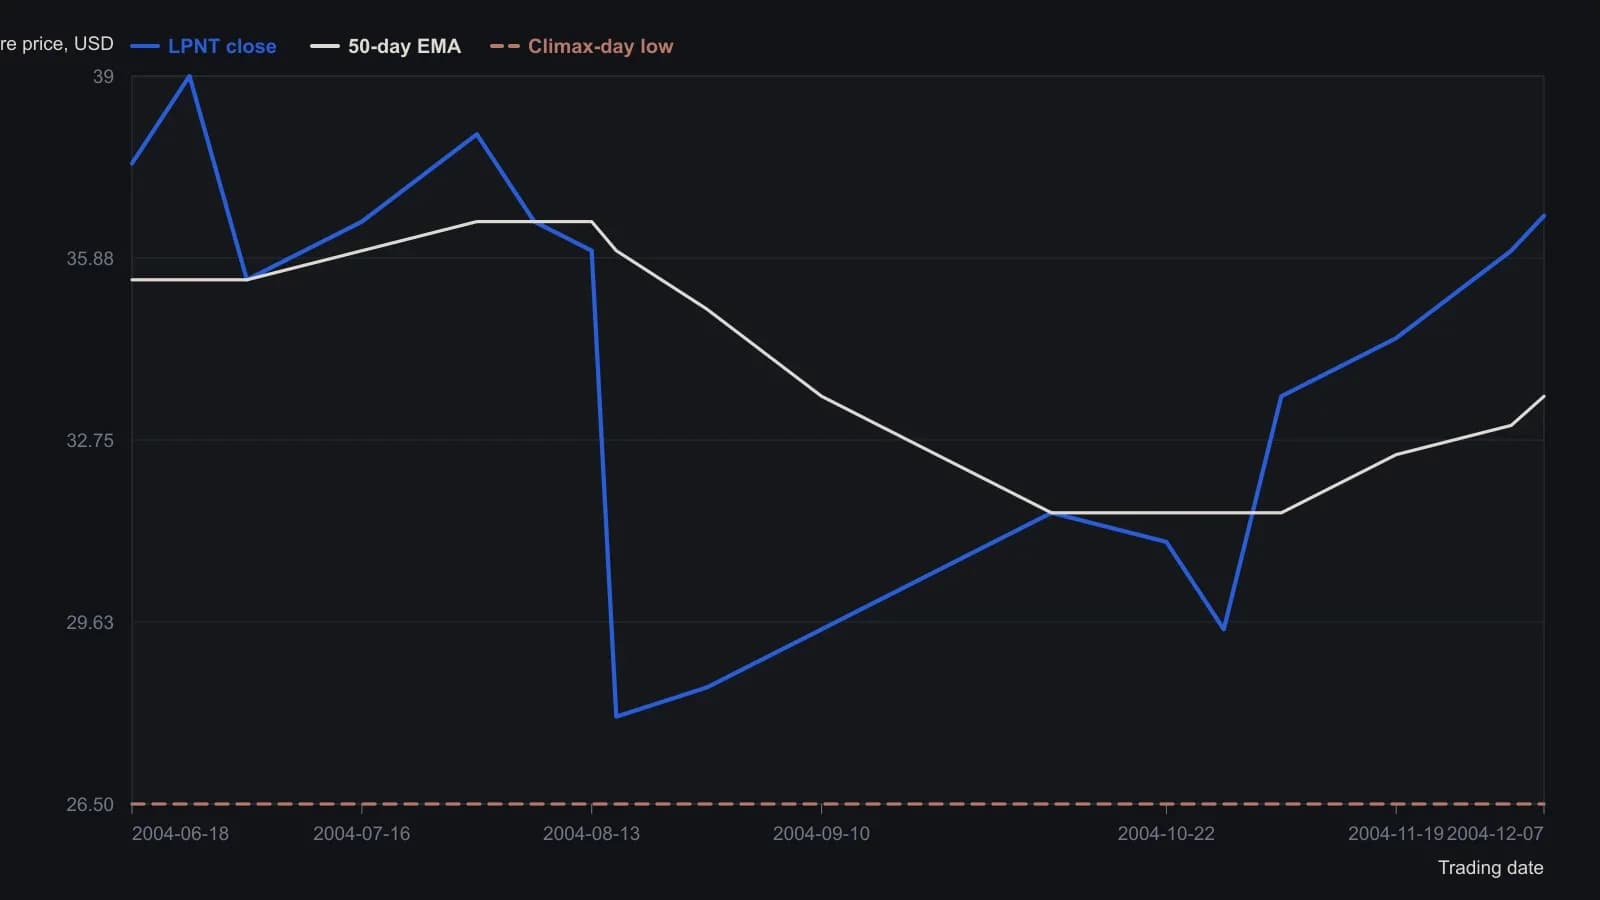
Closes are approximate weekly readings from the daily candlestick pane, rounded to the nearest half dollar. The horizontal level is the climax-day low read off the long lower wick (article: declined to less than 27). Six-month daily Prophet chart with 10-day and 50-day exponential averages.
A contrasting case that failed
A contrasting stock case gapped lower on more than double average volume.
The suspected climax-day low was broken the next session, and a lower low printed within three days.
No positive divergence appeared, and the MACD-histogram trough was less extreme than an earlier July trough.
The climax-day low as the exit
Climax lows are described as usually being retested. The climax-day low is the session low of the suspected washout day, and a later break of that low is treated as a reason to abandon the immediate reversal hypothesis.
All readings on this track · 80 readings
- 1988Rebuild MACD-Mo and MACD-H before treating them as signals
- 1989Four-span MACD lookbacks as perishable parameters
- 1989Weekly then daily MACD confirmation on individual stocks
- 1991Regime-gated MACD and stochastic rules inside a checklist
- 1991Constructing MACD signal lines and divergence tests
- 1991MACD parameter order and cycle phase lag
- 1992Lengthened bond MACD as an equity regime filter
- 1992Long-horizon MACD construction from paired exponential averages
- 1993Constructing a signed ten-point trend filter
- 1994Constructing lag-reduced double exponential averages for MACD
- 1994Seeding DEMA2 filters to build a MACD signal
- 1994Constructing MACD from lag-reduced exponential averages
- 1994TEMA1 from nested exponential averages, then a two-horizon MACD
- 1994Constructing entry and exit on a relative-strength MACD
- 1994Constructing a relative-strength MACD crossover spreadsheet
- 1995Consensus presignal filters for Relative Strength Index, MACD and the Stochastic oscillator
- 1997Confirm the MACD turn with price, then exit on the histogram
- 1997Reconstructing a stochastic oscillator, MACD, and a triple-smoothed oscillator
- 1997Moving-average windows before crossovers and MACD
- 1999Second-stage MACD on relative-strength inputs
- 1999Constructing MACD from exponential-average spreads for crossover and divergence
- 1999Coding candlesticks into numeric indicators
- 2001Second-low confirmation with a percentage oscillator and money-flow filter
- 2001Constructing MACD from exponential average spreads and a signal line
- 2002Separate bounded and trend-following oscillator rules
- 2002Sort the regime before assigning MACD and stochastic jobs
- 2002Building classic divergence filters from RSI and MACD
- 2002Weekly highs and lows as trend gates
- 2002Constructing channel-normalized Fisher reversal signals
- 2002Affine-price and the Fisher transform as a constructed companion to MACD
- 2003Regularized EMA construction with a MACD line and a thrust oscillator
- 2003Curvature-penalized exponential averages versus MACD
- 2003MACD, moving averages, and a trend filter as one timing system
- 2003Fractional MACD and linear-regression reversal construction
- 2004Weekly MACD-histogram timing of bear-market rallies
- 2004Candlestick triggers filtered by MACD divergence
- 2004Staging energy-complex tops with trendline, breakout, and MACD
- 2005Selling climax holds versus fails
- 2006Treat a sideways Wave as permission before a breakout
- 2007MACD with a Stochastic oscillator for spotting trend reversals
- 2007Rebuilding an S&P 500 fifth-wave count after a broken target
- 2007Constructing MACD, RSI, and stochastic confirmation for futures
- 2007MACD histogram divergence needs a confirming close
- 2007Write the plan as a stack: ratio, boundary, then oscillators
- 2008MACD divergence and Stochastic oscillator confirmation on lumber futures
- 2008Assign confirmation, timing, and a stop before a currency pair is tested
- 2008Confirm the ten-bagger launch path before the MACD exit
- 2008Reading the offloaded evidence file
- 2008A Leader companion for MACD direction warnings
- 2008Relative strength exits with MACD averages and RSI
- 2008Assign one job per indicator in a three-screens rule set
- 2008Sequencing RSI, MACD, and average crossovers
- 2010Constructing the Schaff Trend Cycle from MACD and a dominant-cycle window
- 2010Schaff Trend Cycle as a MACD and Stochastic oscillator combination
- 2010Combining Relative Strength Index, the stochastic oscillator, and MACD as slope filters
- 2010Short-term wave and ratio clues without direction calls
- 2010A precise pullback entry and an unplanned profit-protection exit
- 2010Filtering MACD false signals with trendline breaks
- 2011Vendor feeds as an input variable in a MACD evaluation
- 2012Out-of-the-money versus in-the-money option sensitivity to implied volatility
- 2012MACD window tuning as hold-time control
- 2012Combining a moving-average crossover with MACD and support-resistance
- 2012Testing a published MACD entry with a histogram and signal-line agreement filter
- 2012Treat sample systems as a lab before live rules
- 2013Constructing moving averages and MACD from one price series
- 2013The next-bar price that forces a MACD signal-line cross
- 2013Constructing next-bar MACD reversal prices
- 2013Constructing inverted MACD reversal prices
- 2014Shared-filter combinations of the stochastic oscillator, MACD, and RSI
- 2014Square-root lookbacks for combined MACD and RSI
- 2015Audit open interest and trend before trusting oscillator crossovers
- 2016MACD without a signal line, confirmed by moving-average trend filters
- 2016Use RSI, MACD, and a moving average as a market-health consensus
- 2016MACD line versus histogram is a display problem first
- 2017Weekly and daily MACD on a single daily chart
- 2017Weekly and daily MACD as a stacked momentum filter
- 2017Nested weekly and daily MACD from paired EMA spreads
- 2018Weekly and daily PPO scale versus MACD, with bounded RSI and stochastic readings
- 2018Constructing a weekly and daily percentage price oscillator
- 2020Constructing Wyckoff tape reading with MACD, moving-average, and RSI filters