2002issue C111-9
Affine-price and the Fisher transform as a constructed companion to MACD
Affine-price rebuilds a chosen series after trendline-anchors remove a slope. A fisher-transform then maps mid-range-price into a plotted oscillator that can share a chart with MACD.
- Affine-price uses trendline-anchors, each a date, time, and price, to remove a slope and leave a residual.
- A price-multiple and a price-shift keep that residual plottable and non-negative, and the construction can run more than once on rising and falling segments.
- The fisher-transform starts from mid-range-price, uses a lookback-window, and is commonly plotted with a one-bar trigger-line.
- The same Fisher series can be paired with MACD so the oscillator and the signal layer are read together.
What the construction assembles
An affine-price series is a reconstructed price series. It takes explicit trendline-anchors and computes a residual after removing that slope from the chosen price series.
A fisher-transform construction starts from mid-range-price and produces a plotted oscillator. The same Fisher series can be paired on one chart with MACD so the constructed oscillator and the MACD signal layer are read together rather than as isolated studies.
How affine-price is assembled
Trendline-anchors are the start and end points of the chosen segment. Each anchor is specified by date, time, and price, and those points define the slope used in the affine adjustment.
Affine-price subtracts that slope from the observed price so the residual can be scaled and shifted for display. The residual can be multiplied by a price-multiple and then offset by a price-shift so the constructed series remains plottable and non-negative on a chart.
The affine construction is written so it can be applied more than once on one chart, using separate rising and falling trendline segments on the same bar series.
How the fisher-transform is assembled
The fisher-transform starts from mid-range-price, the average of high and low. It measures that series against its lookback high and low, compresses the result, and maps it through a logarithm to produce a plotted oscillator.
The lookback-window is the number of bars used to find the recent high and low of the mid-range-price before normalization. The construction commonly uses a 10-bar lookback-window and a one-bar lag of the oscillator as a trigger-line.
Reading the oscillator with MACD
The same Fisher series can be paired on one chart with MACD so the constructed oscillator and the MACD signal layer are read together rather than as isolated studies.
Editorial: use that pairing to turn a repeatable chart condition into a falsifiable trade hypothesis. The archive describes how the studies are assembled and plotted, not a trading rule.
Period-10 Fisher transform versus MACD on the daily 30-year Treasury bond
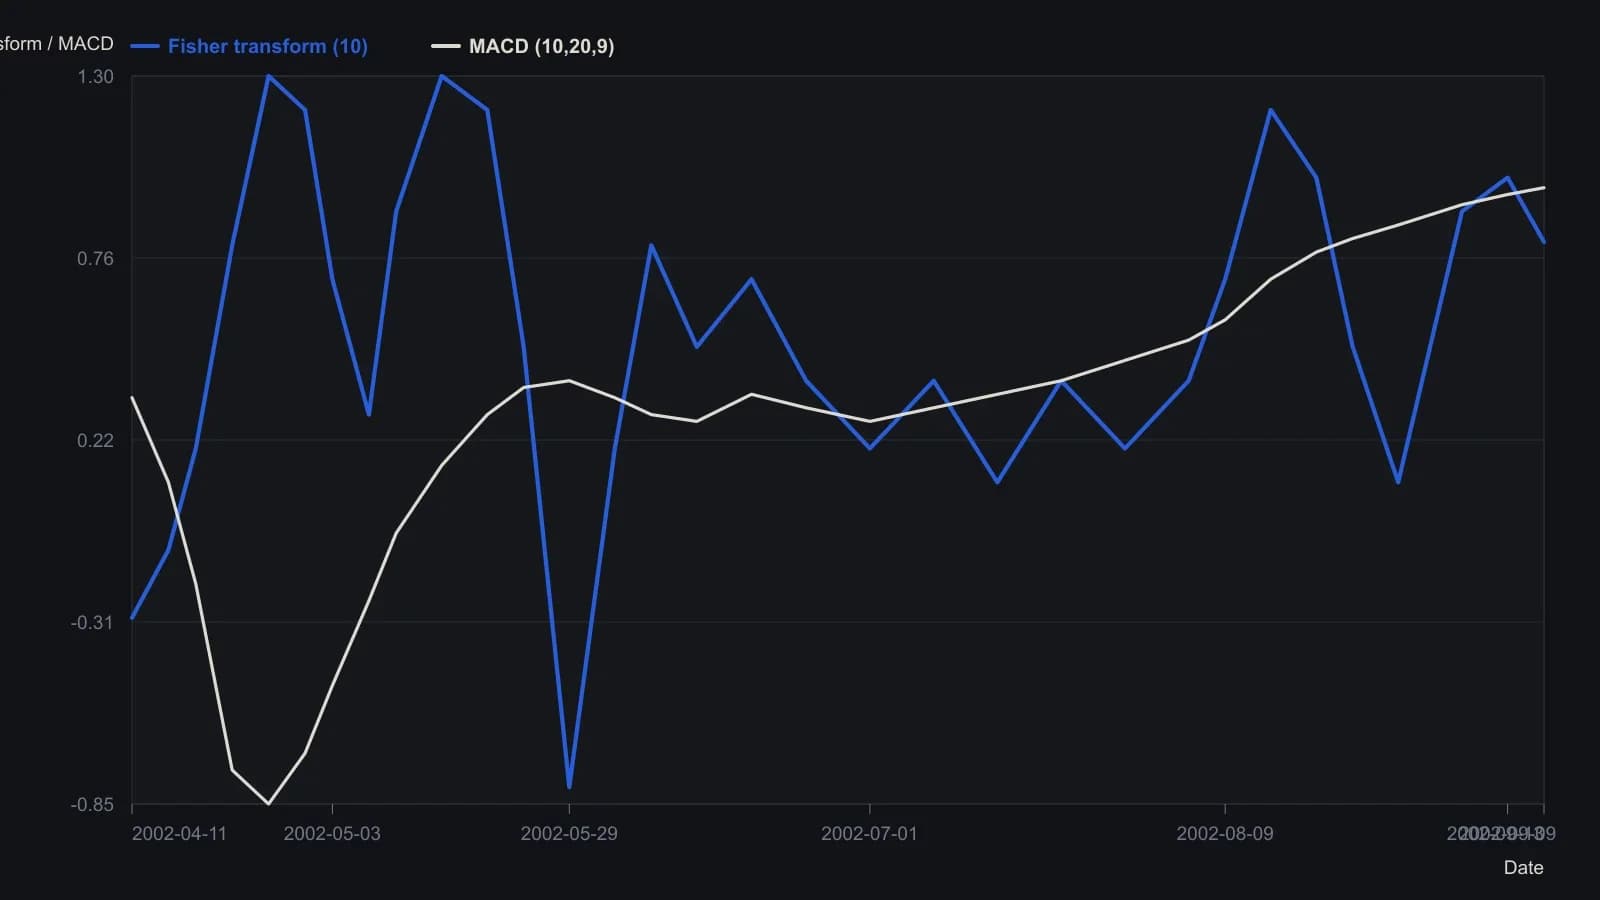
Fisher length is 10 on mid-range price; MACD is 10/20/9 on close. Digitized ordinates are approximate to about one tenth. Only the last-bar quote-window readings are exact. The source draws the two series in separate panes; they happen to share a similar numeric range on this contract.
All readings on this track · 80 readings
- 1988Rebuild MACD-Mo and MACD-H before treating them as signals
- 1989Four-span MACD lookbacks as perishable parameters
- 1989Weekly then daily MACD confirmation on individual stocks
- 1991Regime-gated MACD and stochastic rules inside a checklist
- 1991Constructing MACD signal lines and divergence tests
- 1991MACD parameter order and cycle phase lag
- 1992Lengthened bond MACD as an equity regime filter
- 1992Long-horizon MACD construction from paired exponential averages
- 1993Constructing a signed ten-point trend filter
- 1994Constructing lag-reduced double exponential averages for MACD
- 1994Seeding DEMA2 filters to build a MACD signal
- 1994Constructing MACD from lag-reduced exponential averages
- 1994TEMA1 from nested exponential averages, then a two-horizon MACD
- 1994Constructing entry and exit on a relative-strength MACD
- 1994Constructing a relative-strength MACD crossover spreadsheet
- 1995Consensus presignal filters for Relative Strength Index, MACD and the Stochastic oscillator
- 1997Confirm the MACD turn with price, then exit on the histogram
- 1997Reconstructing a stochastic oscillator, MACD, and a triple-smoothed oscillator
- 1997Moving-average windows before crossovers and MACD
- 1999Second-stage MACD on relative-strength inputs
- 1999Constructing MACD from exponential-average spreads for crossover and divergence
- 1999Coding candlesticks into numeric indicators
- 2001Second-low confirmation with a percentage oscillator and money-flow filter
- 2001Constructing MACD from exponential average spreads and a signal line
- 2002Separate bounded and trend-following oscillator rules
- 2002Sort the regime before assigning MACD and stochastic jobs
- 2002Building classic divergence filters from RSI and MACD
- 2002Weekly highs and lows as trend gates
- 2002Constructing channel-normalized Fisher reversal signals
- 2002Affine-price and the Fisher transform as a constructed companion to MACD
- 2003Regularized EMA construction with a MACD line and a thrust oscillator
- 2003Curvature-penalized exponential averages versus MACD
- 2003MACD, moving averages, and a trend filter as one timing system
- 2003Fractional MACD and linear-regression reversal construction
- 2004Weekly MACD-histogram timing of bear-market rallies
- 2004Candlestick triggers filtered by MACD divergence
- 2004Staging energy-complex tops with trendline, breakout, and MACD
- 2005Selling climax holds versus fails
- 2006Treat a sideways Wave as permission before a breakout
- 2007MACD with a Stochastic oscillator for spotting trend reversals
- 2007Rebuilding an S&P 500 fifth-wave count after a broken target
- 2007Constructing MACD, RSI, and stochastic confirmation for futures
- 2007MACD histogram divergence needs a confirming close
- 2007Write the plan as a stack: ratio, boundary, then oscillators
- 2008MACD divergence and Stochastic oscillator confirmation on lumber futures
- 2008Assign confirmation, timing, and a stop before a currency pair is tested
- 2008Confirm the ten-bagger launch path before the MACD exit
- 2008Reading the offloaded evidence file
- 2008A Leader companion for MACD direction warnings
- 2008Relative strength exits with MACD averages and RSI
- 2008Assign one job per indicator in a three-screens rule set
- 2008Sequencing RSI, MACD, and average crossovers
- 2010Constructing the Schaff Trend Cycle from MACD and a dominant-cycle window
- 2010Schaff Trend Cycle as a MACD and Stochastic oscillator combination
- 2010Combining Relative Strength Index, the stochastic oscillator, and MACD as slope filters
- 2010Short-term wave and ratio clues without direction calls
- 2010A precise pullback entry and an unplanned profit-protection exit
- 2010Filtering MACD false signals with trendline breaks
- 2011Vendor feeds as an input variable in a MACD evaluation
- 2012Out-of-the-money versus in-the-money option sensitivity to implied volatility
- 2012MACD window tuning as hold-time control
- 2012Combining a moving-average crossover with MACD and support-resistance
- 2012Testing a published MACD entry with a histogram and signal-line agreement filter
- 2012Treat sample systems as a lab before live rules
- 2013Constructing moving averages and MACD from one price series
- 2013The next-bar price that forces a MACD signal-line cross
- 2013Constructing next-bar MACD reversal prices
- 2013Constructing inverted MACD reversal prices
- 2014Shared-filter combinations of the stochastic oscillator, MACD, and RSI
- 2014Square-root lookbacks for combined MACD and RSI
- 2015Audit open interest and trend before trusting oscillator crossovers
- 2016MACD without a signal line, confirmed by moving-average trend filters
- 2016Use RSI, MACD, and a moving average as a market-health consensus
- 2016MACD line versus histogram is a display problem first
- 2017Weekly and daily MACD on a single daily chart
- 2017Weekly and daily MACD as a stacked momentum filter
- 2017Nested weekly and daily MACD from paired EMA spreads
- 2018Weekly and daily PPO scale versus MACD, with bounded RSI and stochastic readings
- 2018Constructing a weekly and daily percentage price oscillator
- 2020Constructing Wyckoff tape reading with MACD, moving-average, and RSI filters