2008issue C081-3
Relative strength exits with MACD averages and RSI
A long thesis is retired on the same comparative series used to select it. Rank decay, a MACD of the stock-to-benchmark ratio, or a relative strength index rebuilt on that ratio each mark when relative momentum has rolled over.
- A rank-scale drop below 50 is treated as evidence that a name is no longer outperforming the market and supplies an explicit relative exit threshold.
- An indicator trendline break on the weekly comparative-strength plot is read as a reversal in relative trend and is presented as earlier than a MACD sell on the same ratio.
- The MACD of the ratio subtracts a 26-period exponential average of the stock-to-benchmark close ratio from a 12-period average and sells when that line drops through a 9-period signal.
- The same ratio-for-price substitution can rebuild the relative strength index, or change MACD lookbacks, so the exit stays on the series used for selection.
The same series for selection and exit
One comparative ranking convention maps listed names onto a rank-scale from 1 to 99 and treats a reading above 80 as membership in the strongest fifth of the universe.
The same rank-scale treats a drop below 50 as evidence that a name is no longer outperforming the market, supplying an explicit relative exit threshold.
Editorial: a long thesis is retired only after that rank decay, or after a later overlay on the same series, confirms that relative momentum has rolled over. The exit is taught as a second quantitative filter on the comparative series used for selection.
Trendlines and a point-and-figure filter
A comparative-strength line on a weekly chart can carry indicator trendlines across rising lows. A break of that line is read as a reversal in relative trend, often appearing before an absolute price peak because momentum typically cools first.
Point-and-figure of comparative strength uses a chosen box size and a multi-box reversal, often three, to ignore smaller flips. The point-and-figure filter then watches a 45-degree support line together with a triple-bottom pattern as the exit geometry.
Windows that keep trend-following coherent
The archive frames trend-following in equities as most coherent on three- to twelve-month windows, and describes both shorter and longer horizons as more mean-reverting.
A MACD of the comparative-strength ratio
A 12-period exponential moving average assigns about 15 percent of its value to the latest close, while a 26-period exponential moving average assigns about 7.5 percent, so the shorter span reacts faster than an equal-weight average of the same length.
A comparative-strength ratio is formed by dividing a security close by a broad-market close. A MACD of the ratio is then formed by subtracting a 26-period exponential average of that ratio from a 12-period exponential average of the same ratio, and pairing the line with a 9-period exponential average as the signal.
Sell readings on that comparative MACD occur when the line drops through its own exponential average, a signal-line cross that the archive presents as later than a trendline break on the raw relative-strength plot.
RSI and other overlays on the same ratio
The same ratio-for-price substitution can be applied to other overlays, including the relative strength index or stochastics, or by changing the MACD lookbacks to raise or lower signal frequency. Rebuilding the relative strength index on the comparative-strength ratio offers an alternative count of relative advances versus declines without leaving the series used for selection.
Cisco weekly closes with relative-strength exits
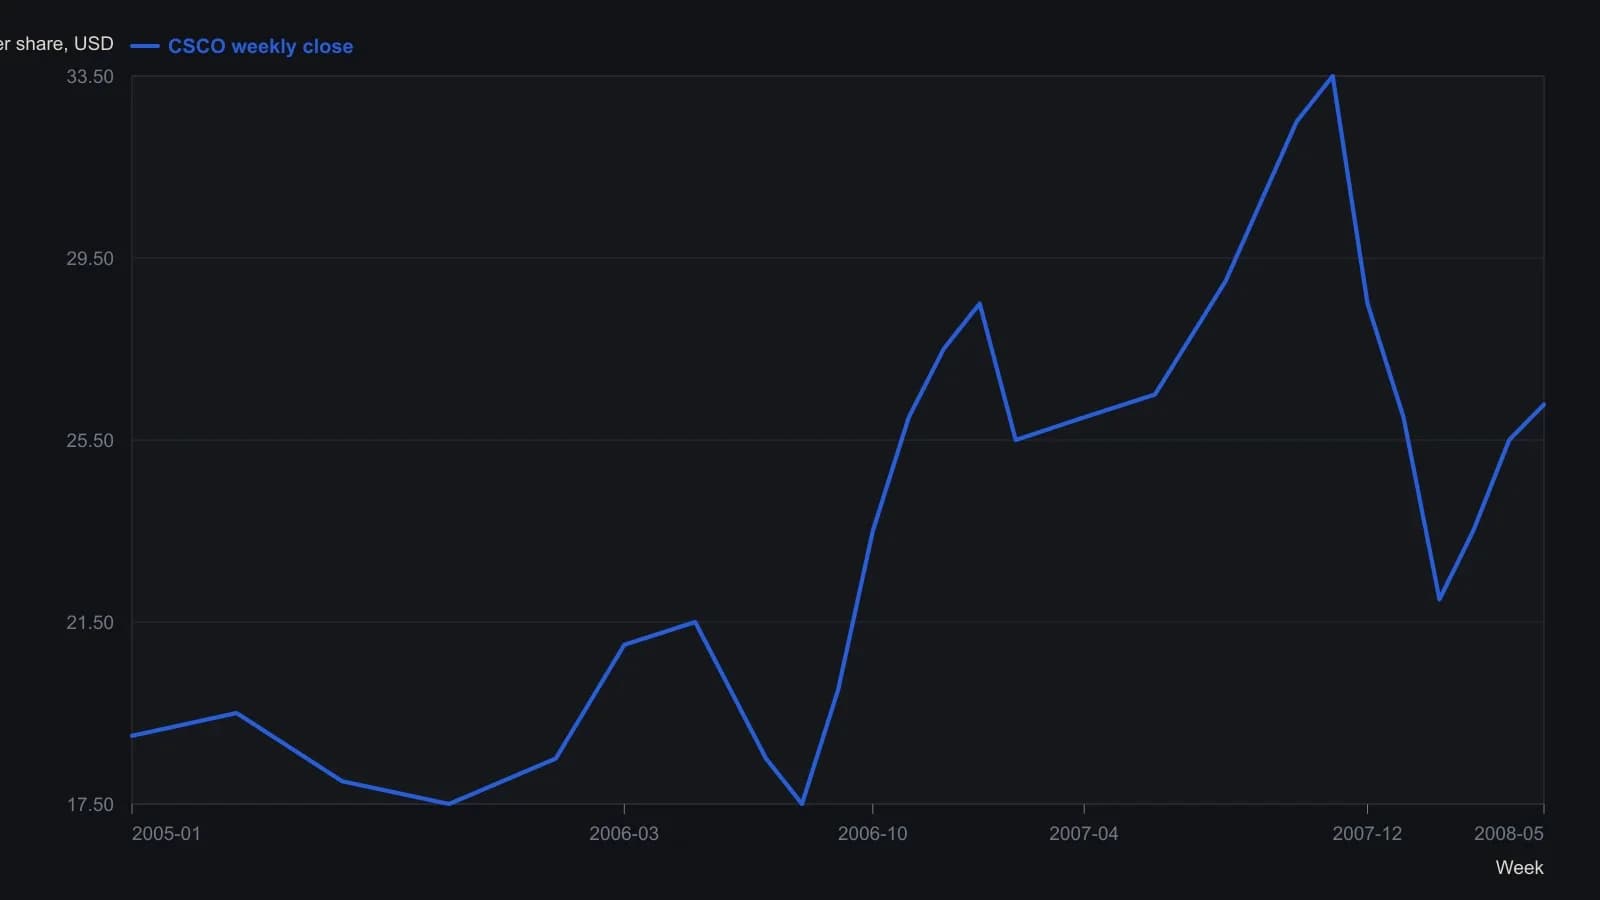
Closes are approximate readings from the weekly-bar raster, generally to the nearest half dollar. The printed quote on the chart is 26.28 on 9 May 2008. The lower MOCS pane uses a separate oscillator scale and is not mixed into this series.
All readings on this track · 80 readings
- 1988Rebuild MACD-Mo and MACD-H before treating them as signals
- 1989Four-span MACD lookbacks as perishable parameters
- 1989Weekly then daily MACD confirmation on individual stocks
- 1991Regime-gated MACD and stochastic rules inside a checklist
- 1991Constructing MACD signal lines and divergence tests
- 1991MACD parameter order and cycle phase lag
- 1992Lengthened bond MACD as an equity regime filter
- 1992Long-horizon MACD construction from paired exponential averages
- 1993Constructing a signed ten-point trend filter
- 1994Constructing lag-reduced double exponential averages for MACD
- 1994Seeding DEMA2 filters to build a MACD signal
- 1994Constructing MACD from lag-reduced exponential averages
- 1994TEMA1 from nested exponential averages, then a two-horizon MACD
- 1994Constructing entry and exit on a relative-strength MACD
- 1994Constructing a relative-strength MACD crossover spreadsheet
- 1995Consensus presignal filters for Relative Strength Index, MACD and the Stochastic oscillator
- 1997Confirm the MACD turn with price, then exit on the histogram
- 1997Reconstructing a stochastic oscillator, MACD, and a triple-smoothed oscillator
- 1997Moving-average windows before crossovers and MACD
- 1999Second-stage MACD on relative-strength inputs
- 1999Constructing MACD from exponential-average spreads for crossover and divergence
- 1999Coding candlesticks into numeric indicators
- 2001Second-low confirmation with a percentage oscillator and money-flow filter
- 2001Constructing MACD from exponential average spreads and a signal line
- 2002Separate bounded and trend-following oscillator rules
- 2002Sort the regime before assigning MACD and stochastic jobs
- 2002Building classic divergence filters from RSI and MACD
- 2002Weekly highs and lows as trend gates
- 2002Constructing channel-normalized Fisher reversal signals
- 2002Affine-price and the Fisher transform as a constructed companion to MACD
- 2003Regularized EMA construction with a MACD line and a thrust oscillator
- 2003Curvature-penalized exponential averages versus MACD
- 2003MACD, moving averages, and a trend filter as one timing system
- 2003Fractional MACD and linear-regression reversal construction
- 2004Weekly MACD-histogram timing of bear-market rallies
- 2004Candlestick triggers filtered by MACD divergence
- 2004Staging energy-complex tops with trendline, breakout, and MACD
- 2005Selling climax holds versus fails
- 2006Treat a sideways Wave as permission before a breakout
- 2007MACD with a Stochastic oscillator for spotting trend reversals
- 2007Rebuilding an S&P 500 fifth-wave count after a broken target
- 2007Constructing MACD, RSI, and stochastic confirmation for futures
- 2007MACD histogram divergence needs a confirming close
- 2007Write the plan as a stack: ratio, boundary, then oscillators
- 2008MACD divergence and Stochastic oscillator confirmation on lumber futures
- 2008Assign confirmation, timing, and a stop before a currency pair is tested
- 2008Confirm the ten-bagger launch path before the MACD exit
- 2008Reading the offloaded evidence file
- 2008A Leader companion for MACD direction warnings
- 2008Relative strength exits with MACD averages and RSI
- 2008Assign one job per indicator in a three-screens rule set
- 2008Sequencing RSI, MACD, and average crossovers
- 2010Constructing the Schaff Trend Cycle from MACD and a dominant-cycle window
- 2010Schaff Trend Cycle as a MACD and Stochastic oscillator combination
- 2010Combining Relative Strength Index, the stochastic oscillator, and MACD as slope filters
- 2010Short-term wave and ratio clues without direction calls
- 2010A precise pullback entry and an unplanned profit-protection exit
- 2010Filtering MACD false signals with trendline breaks
- 2011Vendor feeds as an input variable in a MACD evaluation
- 2012Out-of-the-money versus in-the-money option sensitivity to implied volatility
- 2012MACD window tuning as hold-time control
- 2012Combining a moving-average crossover with MACD and support-resistance
- 2012Testing a published MACD entry with a histogram and signal-line agreement filter
- 2012Treat sample systems as a lab before live rules
- 2013Constructing moving averages and MACD from one price series
- 2013The next-bar price that forces a MACD signal-line cross
- 2013Constructing next-bar MACD reversal prices
- 2013Constructing inverted MACD reversal prices
- 2014Shared-filter combinations of the stochastic oscillator, MACD, and RSI
- 2014Square-root lookbacks for combined MACD and RSI
- 2015Audit open interest and trend before trusting oscillator crossovers
- 2016MACD without a signal line, confirmed by moving-average trend filters
- 2016Use RSI, MACD, and a moving average as a market-health consensus
- 2016MACD line versus histogram is a display problem first
- 2017Weekly and daily MACD on a single daily chart
- 2017Weekly and daily MACD as a stacked momentum filter
- 2017Nested weekly and daily MACD from paired EMA spreads
- 2018Weekly and daily PPO scale versus MACD, with bounded RSI and stochastic readings
- 2018Constructing a weekly and daily percentage price oscillator
- 2020Constructing Wyckoff tape reading with MACD, moving-average, and RSI filters