1996issue C101-5
Regime-aware allocation beyond a single equity trend
A long equity advance can be housed in a multi-asset mix so a later regime change is handled as Asset allocation and Diversification. A Japanese peak-to-trough analog, a long US advance sample, and a Sharpe ratio style mix check show the construction frame.
- Editorial: a long equity run can be placed inside a multi-asset mix so a later regime change is treated as Asset allocation and Diversification, not as a forecast of the next path.
- A historical Japanese equity peak-to-trough path was used as a regime analog, with a staged drop, rebound, and further decline that reached a 63.6 percent total decline by August 1992.
- Asset-class mix was treated as the dominant construction lever, and a noncorrelated commodity or managed-futures sleeve was proposed to cushion equity and bond declines without relying only on puts or short stock hedges.
- A backtested mix of 52.01 percent S&P 500, 30.34 percent Lehman Bond Index, and 17.65 percent CTA management produced a return-to-standard-deviation ratio of 2.70 over the compared period.
A construction problem, not a forecast problem
Editorial: a single long equity run can be placed inside a multi-asset mix so a later market-regime change is handled as a construction task. Asset allocation and Diversification then set the sleeve weights. The analog describes what a decline might look like. It is not used to call the next tick.
Editorial: the working unit is the mix. A later selloff is treated as a change in regime that the mix has to absorb, rather than as a signal that must be timed in isolation.
A Japanese peak-to-trough analog
A historical Japanese equity peak-to-trough path was used as a regime analog for what a later US equity decline might look like after a long advance.
The analog sequence included a first-stage drop near 30 percent in four months, then a 22 percent rebound, then a further 40 percent decline. The path produced about a 49.2 percent loss in ten months and a 63.6 percent total decline by August 1992.
Nikkei monthly path into the 1990 break
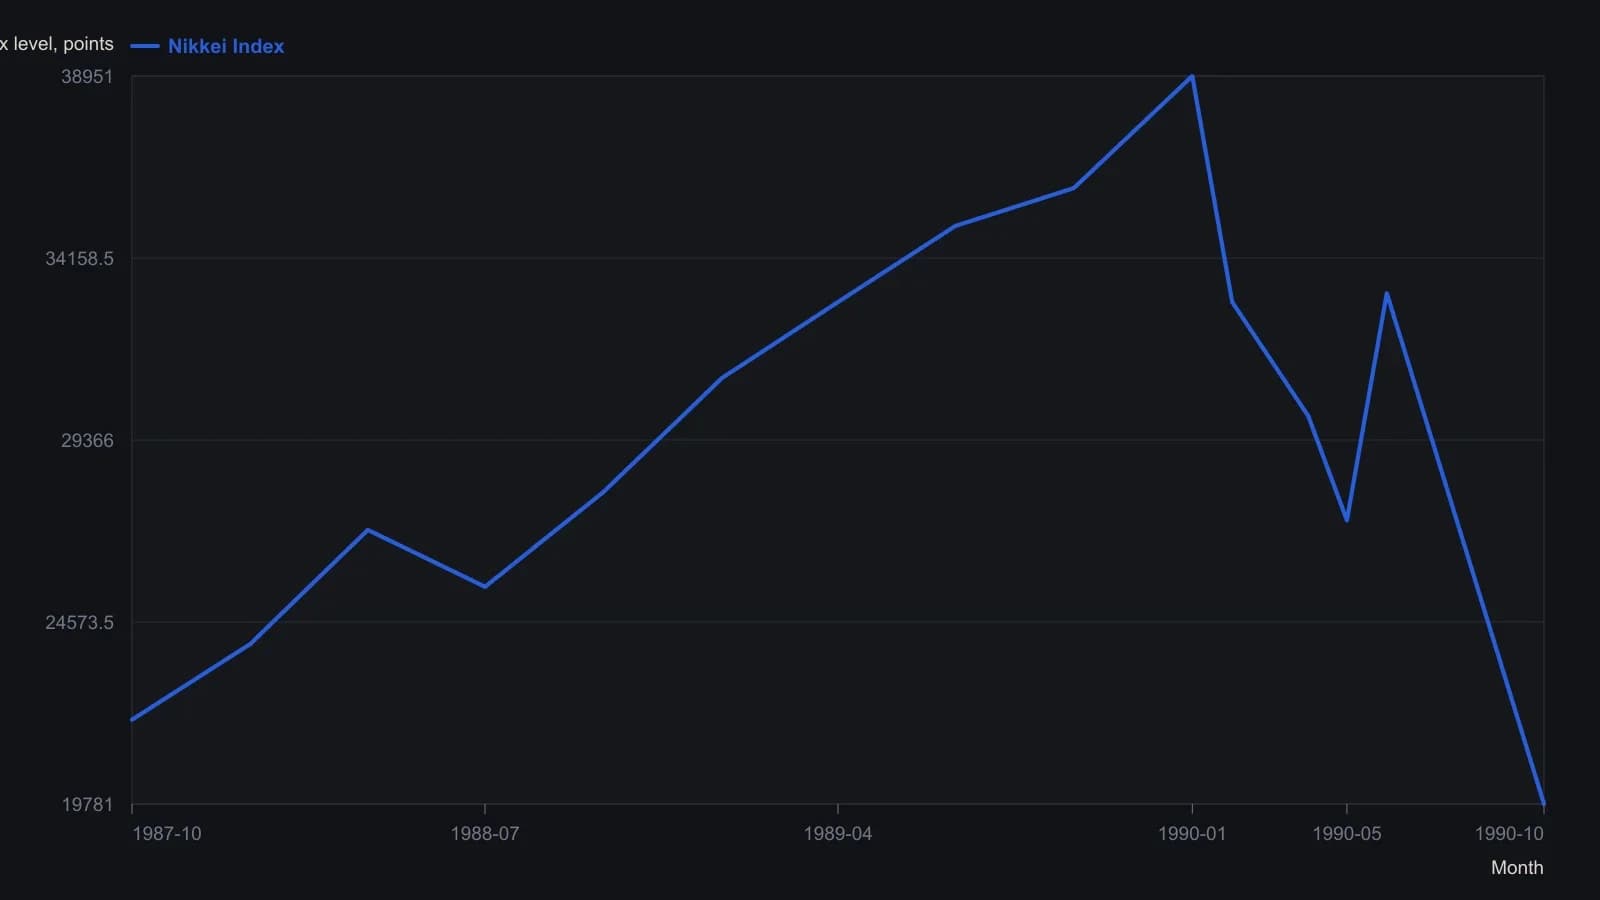
Linear monthly bars. Digitized levels are rounded to 500 index points. January 1990 (38951), the four-month low (27251), the one-month 22 percent rebound (33228), and October 1990 (19781) are the article’s stated prints, not visual estimates.
Where the then-current advance sat
A US intermediate-advance sample since 1896 counted nine rallies greater than 50 percent. The then-current advance was ranked seventh largest and fourth longest.
Unlike the other 50 percent advances in that sample, which began within 15 months of a major bottom, the then-current rally started on November 23, 1994, more than four years into the cycle.
A correction was defined as a selloff of one-third to two-thirds of the prior advance lasting weeks to months, with a first-leg estimate near an 18 to 20 percent decline in about 30 days.
Asset allocation as the main lever
Asset-class mix was treated as the dominant construction lever, with a cited study attributing 91.5 percent of portfolio profit to the chosen asset class rather than security selection inside the class.
A noncorrelated commodity or managed-futures sleeve was proposed as a way to cushion equity and bond declines without relying only on puts or short stock hedges.
Managed futures run by commodity trading advisors were judged, on the author's commodity-investing research, to outperform a long commodity index or a selected basket of commodities across both up and down periods.
A Sharpe ratio check on the mix
A backtested mix of 52.01 percent S&P 500, 30.34 percent Lehman Bond Index, and 17.65 percent CTA management produced a return-to-standard-deviation ratio of 2.70 over the compared period.
Editorial: that return-to-standard-deviation comparison is the Sharpe ratio style check on the mix. It compares an explicit quantitative baseline for the diversified sleeves, not a forecast of a single equity trend.
All readings on this track · 12 readings
- 1986Auditing stochastic crossovers with moving-average baselines
- 1994Evaluating system changes with chi-square, Sharpe, and leverage
- 1995Evaluating mechanical switch rules with a stop-loss order and Sharpe ratio
- 1995Intermediate-term allocation with drawdown filters
- 1996Evaluating a multi-market book without picking winners
- 1996Regime-aware allocation beyond a single equity trend
- 1997Evaluating managed futures as portfolio diversifiers
- 2008Audit an out-of-the-money covered-call overlay against a Sharpe control
- 2013Constructing the Sharpe ratio as return over variability
- 2014Expected value and bet size are separate controls
- 2015Constructing a Sharpe-style score from profit and loss variability
- 2019Continuous futures series and long-horizon allocation evaluation