2020issue C1234-39
Two clocks for a Nasdaq put/call sleeve
Editorial reading: treat Nasdaq exposure as a slow put/call climate plus a fast sentiment band. One buy-level turns a long-only sleeve on or off, so entry, exit, and sitting out are tested as a single procedure.
- Write index put/call rules as distance from a drifting 200-day mean, not as fixed absolute levels, because a several-day swing sits on a slower multi-month drift.
- A single buy-level opens the Nasdaq sleeve when a two-day put/call average is a chosen percentage above that mean and closes it when the same average is the same percentage below.
- Fill at the next session open after the end-of-day print, and keep the sleeve long-only or flat.
- The same sentiment switch can place capital in a short list of strongest-momentum Nasdaq names when it is on, while an exposure budget near or below half leaves room for other sleeves.
Two clocks, one procedure
Editorial: portfolio construction is a two-clock problem. The sma200-mean is the slow clock, a 200-day simple average of the index put/call series treated as a slowly drifting climate rather than a fixed numerical threshold. The fast clock is a two-day-sma of the same put-call-ratio. A chosen buy-level around that mean decides whether the Nasdaq sleeve is on or off.
That framing lets entry, exit, and sitting out be written as one procedure. The archive workflow is a historical long-only sleeve. The two-clock reading is editorial.
What the put/call print measures
The put-call-ratio used here is daily index-option put volume divided by call volume. It is a traded-volume sentiment gauge, not a list of outstanding contracts.
Index put/call readings tend to center near 1.0, while equity put/call readings tend to center near 0.7. Hedging demand concentrates in index options, and single-stock issuance leans toward calls. The historical Nasdaq procedure follows the index series.
Write rules as distance from a moving mean
The index put/call series has two timescales. A several-day swing of about 20% to 30% sits on a slower drift of 10% to 20% or more over months and years.
Rules should be written as distance from a moving mean such as a 200-day average rather than as fixed absolute levels. The sma200-mean is that climate: it can wander, so a fixed numerical cutoff fights the slow clock.
One buy-level turns the sleeve on and off
The long-only Nasdaq procedure buys when a two-day-sma of the index put/call ratio is a chosen percentage above the sma200-mean and exits when that same two-day average is the same percentage below the mean.
The buy-level is that single distance. It opens a long Nasdaq position on excess pessimism and later closes it on excess optimism. The sleeve then stays long-only-or-flat: either long a Nasdaq-linked vehicle or out of the market.
The two-day-sma is only a short smoother. Its job is to keep one noisy print from flipping the sleeve.
Fill at the next open
The put/call print is released after the cash session. The tested procedure therefore uses next-open-execution: it opens and closes at the next day's open rather than on the close of the signal day.
Sweep one distance
System-optimization here is a one-parameter sweep of how far the smoothed put/call reading must sit from its long moving average before the sleeve turns on or off.
On daily Nasdaq tests from 8 January 2007 through 21 August 2020, with $10 slippage and commissions per trade, a single buy-level parameter was swept. The 1.03 to 1.12 band, and especially 1.08, was treated as the stable and preferred distance from the 200-day mean.
Yearly return versus put/call buy level
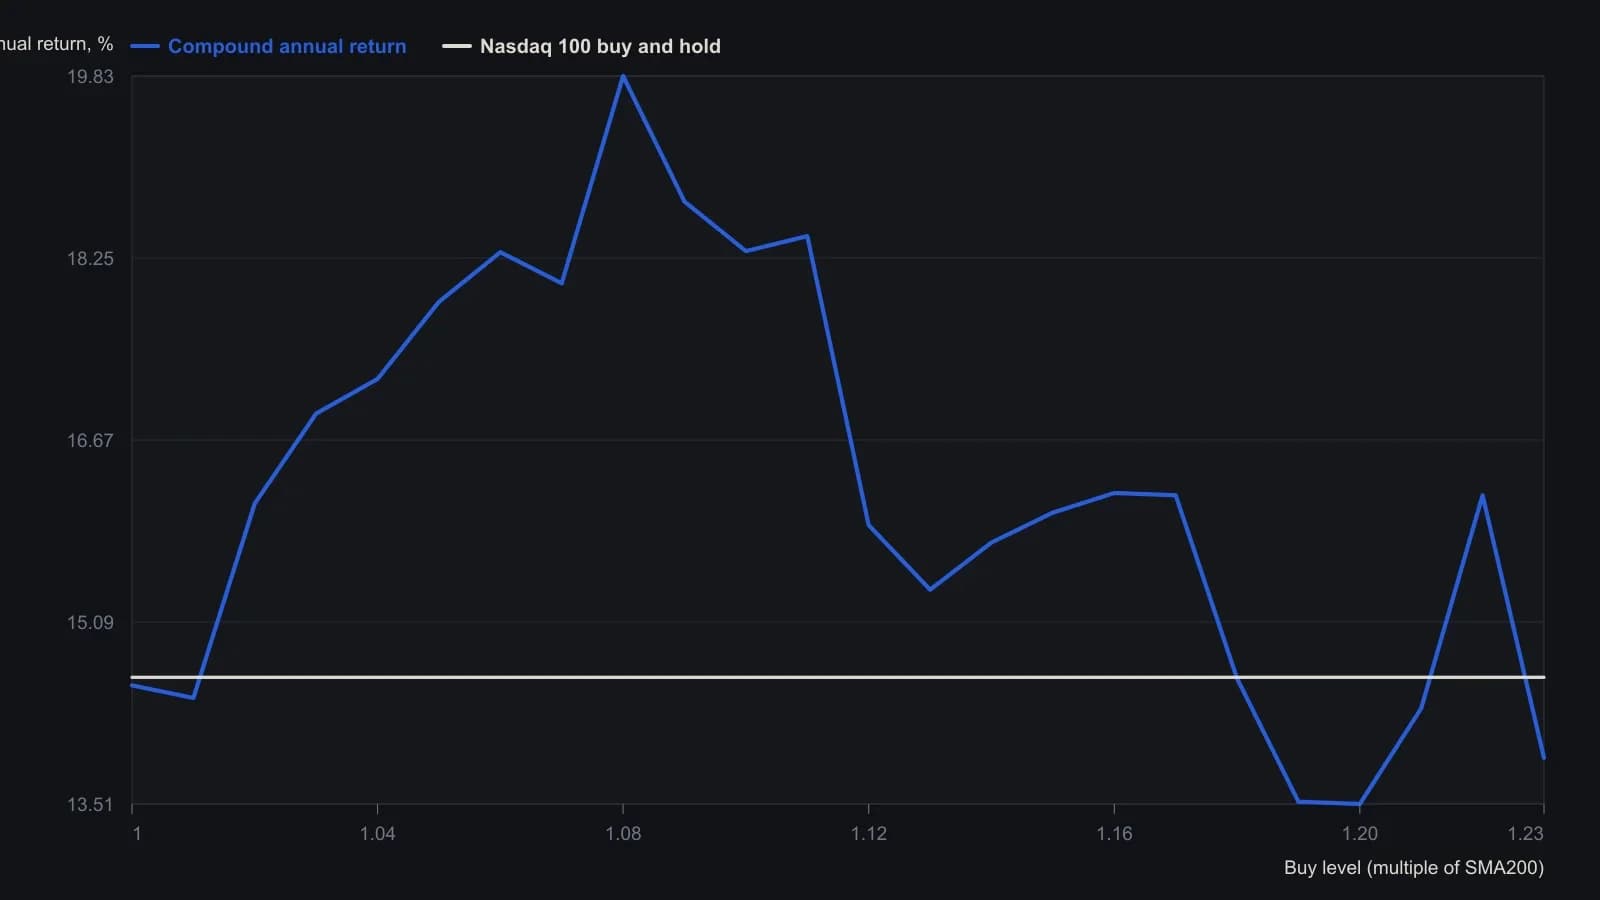
Long-only or flat; $10 slippage and commission per trade; fills at the next open. The author marks buy levels 1.03 through 1.12 as the stable pocket and 1.08 as best on both return and return/risk.
Budget the time the sleeve is invested
Across that stable band the tests typically produced about 15% to 20% compounded annual return, drawdowns near 25%, and market exposure around or below 50%. The sleeve was invested only about half the time.
That share of calendar time is the exposure-budget. When the sentiment switch is off, capital is free for other sleeves.
When the switch is on, hold the vehicle or rank names
The same sentiment switch can be used as a rank-rotation filter. Rank-rotation, as used here, is a long-only sleeve that is either fully invested in a Nasdaq-linked vehicle or cash, then optionally ranks a short list of Nasdaq names by momentum when the sentiment filter is on.
The momentum-filter places capital in a handful of Nasdaq names with the strongest recent momentum rather than only in the index vehicle. The archive reported that this ranking step improved the historical results. The same switch can sit on a liquid Nasdaq-100 vehicle instead of, or under, that short list.
How the three procedures fit together
Editorial: rank-rotation, system-optimization, and seasonal-trading combine as one testable sleeve. System-optimization chooses the buy-level that turns the sleeve on and off. Rank-rotation decides whether the on-state holds a Nasdaq vehicle or a short momentum list.
Seasonal-trading is a calendar overlay that withholds new entries in historically weak months so the same sentiment rules are not forced to trade through a known seasonal drag. The archive facts do not name those months. Treat the overlay as a teaching way to keep abstention inside the same procedure.
Keep the off-state flat
Replacing the flat state with a short book based on the same put/call extremes generally worsened historical results, so the procedure was left long-only. The historical workflow found no useful short counterpart from the same ratio.
All readings on this track · 39 readings
- 1987A mechanical rank-rotation sleeve for monthly fund leaders
- 1989Rank rotation in a five-name no-load sleeve
- 1990Cycle-tested five-year fund rank rotation
- 1991Blue-chip rank rotation by relative-strength-index slope
- 1992Currency rank rotation and intermarket timing
- 1992Rank rotation and relative strength for portfolio construction
- 1994MACD crossovers then short-horizon rank rotation
- 1994A comparable group-trend ledger from published ranks
- 1997Normalized yield rank rotation as a full portfolio procedure
- 1997Constructing an investor preference index from two capitalization-weighted series
- 1998Constructing anchored momentum from a centered average
- 2000Rank rotation, a stop-loss order, and Relative Strength Index in fund switching
- 2003A one-fund daily rank is a two-sleeve construction problem
- 2004Evaluate rank rotation only where persistence already exists
- 2004Sector fund rank rotation with regression and trailing stops
- 2006Evaluating equal-weight annual yield-rank rotation
- 2007Weekly preferred-symbol reselection for mechanical trend systems
- 2011Portfolio capacity and entry pacing for mechanical systems
- 2011Rank rotation as a testable ETF construction procedure
- 2011The inverse-Fisher stochastic is a forecast layer until the book rules can be disabled
- 2012An underwater stretch is a sizing test for rank rotation
- 2015Rule-based ETF rotation as one testable procedure
- 2015MACD crossover evaluation by trend rank rotation
- 2015Persistence and strength as one close-to-close switch
- 2015Evaluating rank rotation after a persistence screen
- 2016Evaluating an annual valuation rank rotation
- 2017A two-step yield and price rank rotation for a five-name sleeve
- 2018Smoothed volatility and the missing rank-rotation exit
- 2018A five-condition scorecard that ranks stocks and can refuse the trade
- 2018Small-cap growth sleeve eligibility with trend and rank rotation
- 2018Evaluating rank-rotation momentum across fund wrappers
- 2019Evaluating an annual equity-gold momentum rank rotation
- 2019Evaluating equity-gold momentum on funds versus indexes
- 2020How a signed comparative-strength oscillator is built for rank rotation
- 2020Which calendar clock changes a gold-versus-equity rotation test
- 2020Four-dimension relative strength as rank rotation
- 2020Portfolio construction as a ranked relative-strength problem
- 2020Two clocks for a Nasdaq put/call sleeve
- 2020Rank, filter, and stop the hedge sleeve as one procedure