1991issue C051-9
Blue-chip rank rotation by relative-strength-index slope
This case study ranks the 30 Dow Jones Industrial Average members with a relative-strength-index, buys when a leader makes a new high, sells after relative strength falls below average, and caps any single position at 10 percent of assets.
- Rank rotation ranks a fixed candidate list by relative performance, owns current leaders, exits when rank or slope no longer supports the holding, and treats abstention from weak names as part of the same rule.
- The relative-strength-index divides a stock's percentage price change by the percentage price change of a market index. The signal is the relative-strength-slope, not the level of that line.
- The case study uses a constrained universe of the 30 Dow Jones Industrial Average members and a 10 percent position cap so rotation stays among large, established companies.
- Leadership can rotate across groups. Oil names led versus the index in 1979-1980 and then underperformed, while a consumer name began a rising relative-strength line in 1981.
One rule for entry, exit, and abstention
The construction rule is to own the strongest relative-strength names in a chosen population until those names no longer show the best relative strength. Rank rotation here requires buying when a leader makes a new high and selling after relative strength falls below average. Abstention from weak names belongs to the same procedure.
Read the slope of the relative-strength-index
Relative strength is defined as a stock's percentage price change divided by the percentage price change of a market index. That comparison is the relative-strength-index used in this case study. The signal is the relative-strength-slope, not the level of the line. An upward slope is treated as better-than-average performance versus the index.
A constrained universe and a position cap
The case study limits the ranked universe to the 30 Dow Jones Industrial Average members so selection stays among large, established companies. That constrained universe keeps rotation inside familiar names rather than an open-ended search. Any single position was capped at 10 percent of assets. Names with poor relative strength, including Union Carbide and General Motors, were excluded.
The late-1990 worked portfolio
In the last quarter of 1990 the procedure selected names with rising relative strength and sold them when relative strength declined, after reviewing all but one of the 30 index members. The worked portfolio contained Boeing, Coca Cola, Philip Morris, Merck, Procter and Gamble, and Tambrands, with Tambrands the only name outside the 30-stock index.
Leadership can rotate across groups
Leadership can rotate across groups. Oil names led versus the index in 1979-1980 and then underperformed after 1980, while a consumer name began a rising relative-strength line in 1981 as a 1982 monthly index chart marks the start of a bull market.
General Motors weekly price and relative strength, 1987–1991
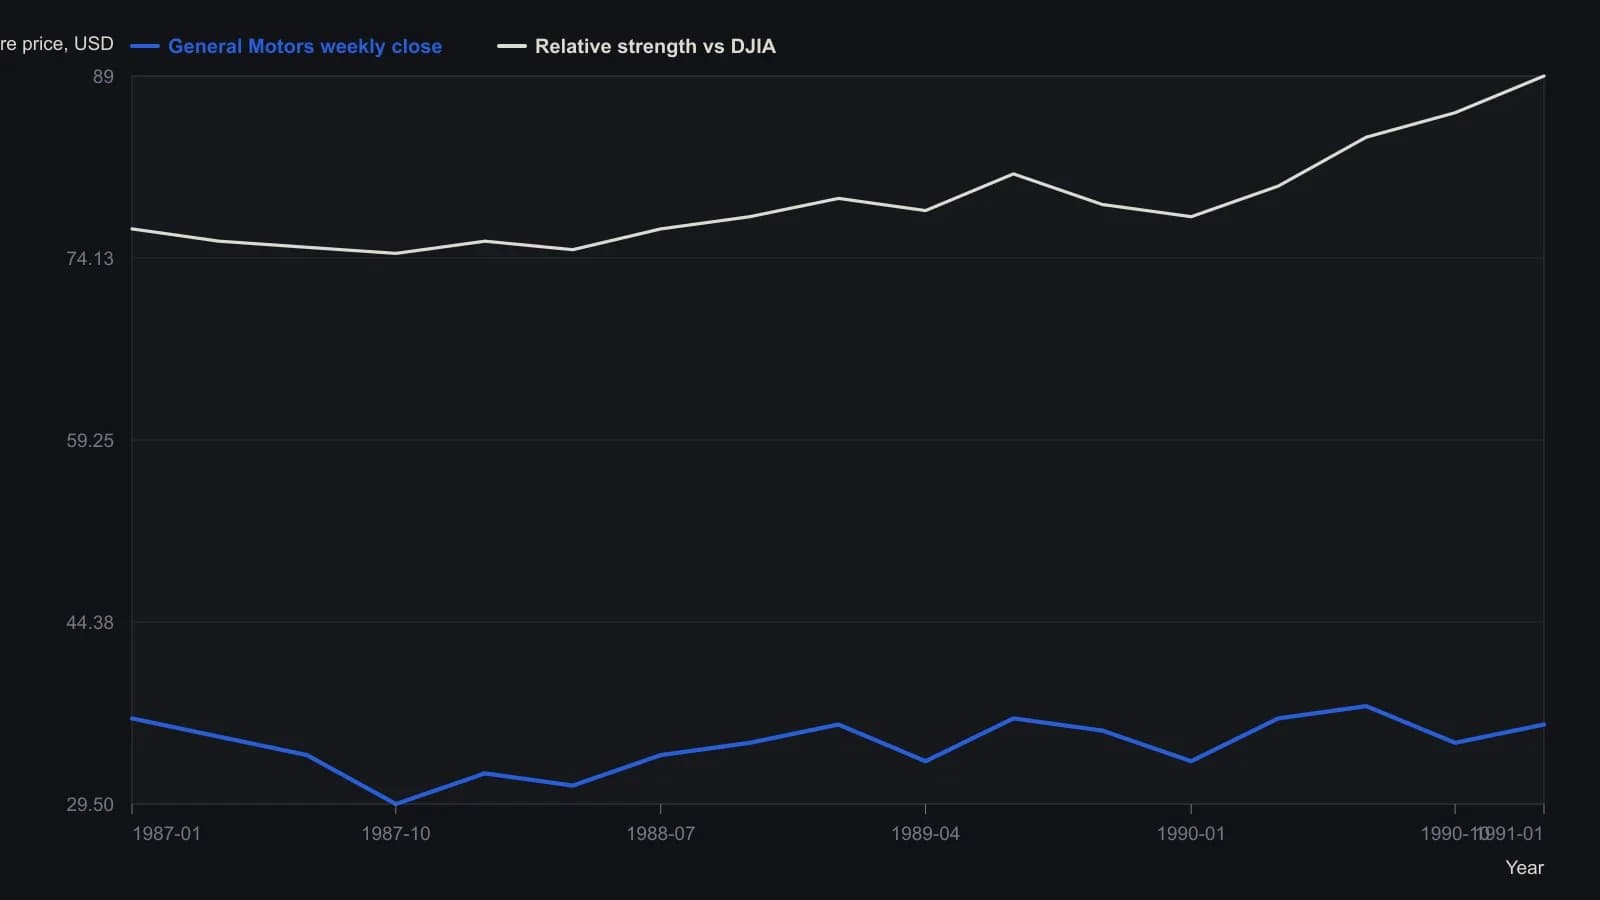
Weekly Telescan reprint; closes and the relative-strength line are digitized from the raster, so levels are approximate. Relative strength is the article’s stock-versus-DJIA ratio, not Wilder RSI.
All readings on this track · 39 readings
- 1987A mechanical rank-rotation sleeve for monthly fund leaders
- 1989Rank rotation in a five-name no-load sleeve
- 1990Cycle-tested five-year fund rank rotation
- 1991Blue-chip rank rotation by relative-strength-index slope
- 1992Currency rank rotation and intermarket timing
- 1992Rank rotation and relative strength for portfolio construction
- 1994MACD crossovers then short-horizon rank rotation
- 1994A comparable group-trend ledger from published ranks
- 1997Normalized yield rank rotation as a full portfolio procedure
- 1997Constructing an investor preference index from two capitalization-weighted series
- 1998Constructing anchored momentum from a centered average
- 2000Rank rotation, a stop-loss order, and Relative Strength Index in fund switching
- 2003A one-fund daily rank is a two-sleeve construction problem
- 2004Evaluate rank rotation only where persistence already exists
- 2004Sector fund rank rotation with regression and trailing stops
- 2006Evaluating equal-weight annual yield-rank rotation
- 2007Weekly preferred-symbol reselection for mechanical trend systems
- 2011Portfolio capacity and entry pacing for mechanical systems
- 2011Rank rotation as a testable ETF construction procedure
- 2011The inverse-Fisher stochastic is a forecast layer until the book rules can be disabled
- 2012An underwater stretch is a sizing test for rank rotation
- 2015Rule-based ETF rotation as one testable procedure
- 2015MACD crossover evaluation by trend rank rotation
- 2015Persistence and strength as one close-to-close switch
- 2015Evaluating rank rotation after a persistence screen
- 2016Evaluating an annual valuation rank rotation
- 2017A two-step yield and price rank rotation for a five-name sleeve
- 2018Smoothed volatility and the missing rank-rotation exit
- 2018A five-condition scorecard that ranks stocks and can refuse the trade
- 2018Small-cap growth sleeve eligibility with trend and rank rotation
- 2018Evaluating rank-rotation momentum across fund wrappers
- 2019Evaluating an annual equity-gold momentum rank rotation
- 2019Evaluating equity-gold momentum on funds versus indexes
- 2020How a signed comparative-strength oscillator is built for rank rotation
- 2020Which calendar clock changes a gold-versus-equity rotation test
- 2020Four-dimension relative strength as rank rotation
- 2020Portfolio construction as a ranked relative-strength problem
- 2020Two clocks for a Nasdaq put/call sleeve
- 2020Rank, filter, and stop the hedge sleeve as one procedure