2018issue C057
Smoothed volatility and the missing rank-rotation exit
A published overlay applied a 10-week moving-average to implied-volatility prints in order to follow the trend rather than isolated spikes. This editorial critique uses that axis, the author reply, and an incomplete rank-rotation rule to show why a momentum-strategy is not auditable until the exit is as explicit as the entry.
- A 10-week moving-average was applied to implied-volatility prints to follow the trend rather than isolated spikes, and a reader saw the overlay axis peak near 43 instead of the much higher unsmoothed 2008 index highs.
- The author reply treated a breakdown in an equal-weight broad equity index as the market-state cue for shifting toward a volatility-buying allocation.
- A 10-quarter moving-average needs 2.5 years before the first complete value, so a study dated from 2000 must prime with earlier observations or delay recording.
- The rank-rotation entry bought a ranked exchange-traded fund only when it stood above its moving-average, the matching exit was not specified, and a critic asked whether that filter improved or worsened the rotation results.
Following the trend rather than isolated spikes
A published volatility overlay applied a 10-week moving-average to implied-volatility prints in order to follow the trend rather than isolated spikes. A moving-average is a lookback average of ordered price or volatility observations used to define a trend filter and suppress isolated spikes.
Editorial reading: that overlay is also a case of regime-smoothing. A long moving-average can mute crisis peaks and change when a market breakdown appears to occur.
A peak the overlay no longer matches
A reader observed that the overlay’s volatility axis peaked near 43, which did not match the much higher unsmoothed 2008 index highs.
Editorial reading: once the series is smoothed, the visible peak is a property of the filter, not the same mark as the unsmoothed crisis print. Regime-smoothing can change when a stress episode looks extreme.
The author reply treated a breakdown in an equal-weight broad equity index as the market-state cue for shifting toward a volatility-buying allocation. Editorial reading: after the volatility axis has been rewritten, that equity breakdown becomes the explicit regime mark for the allocation shift.
Cboe Volatility Index, 2008–2018
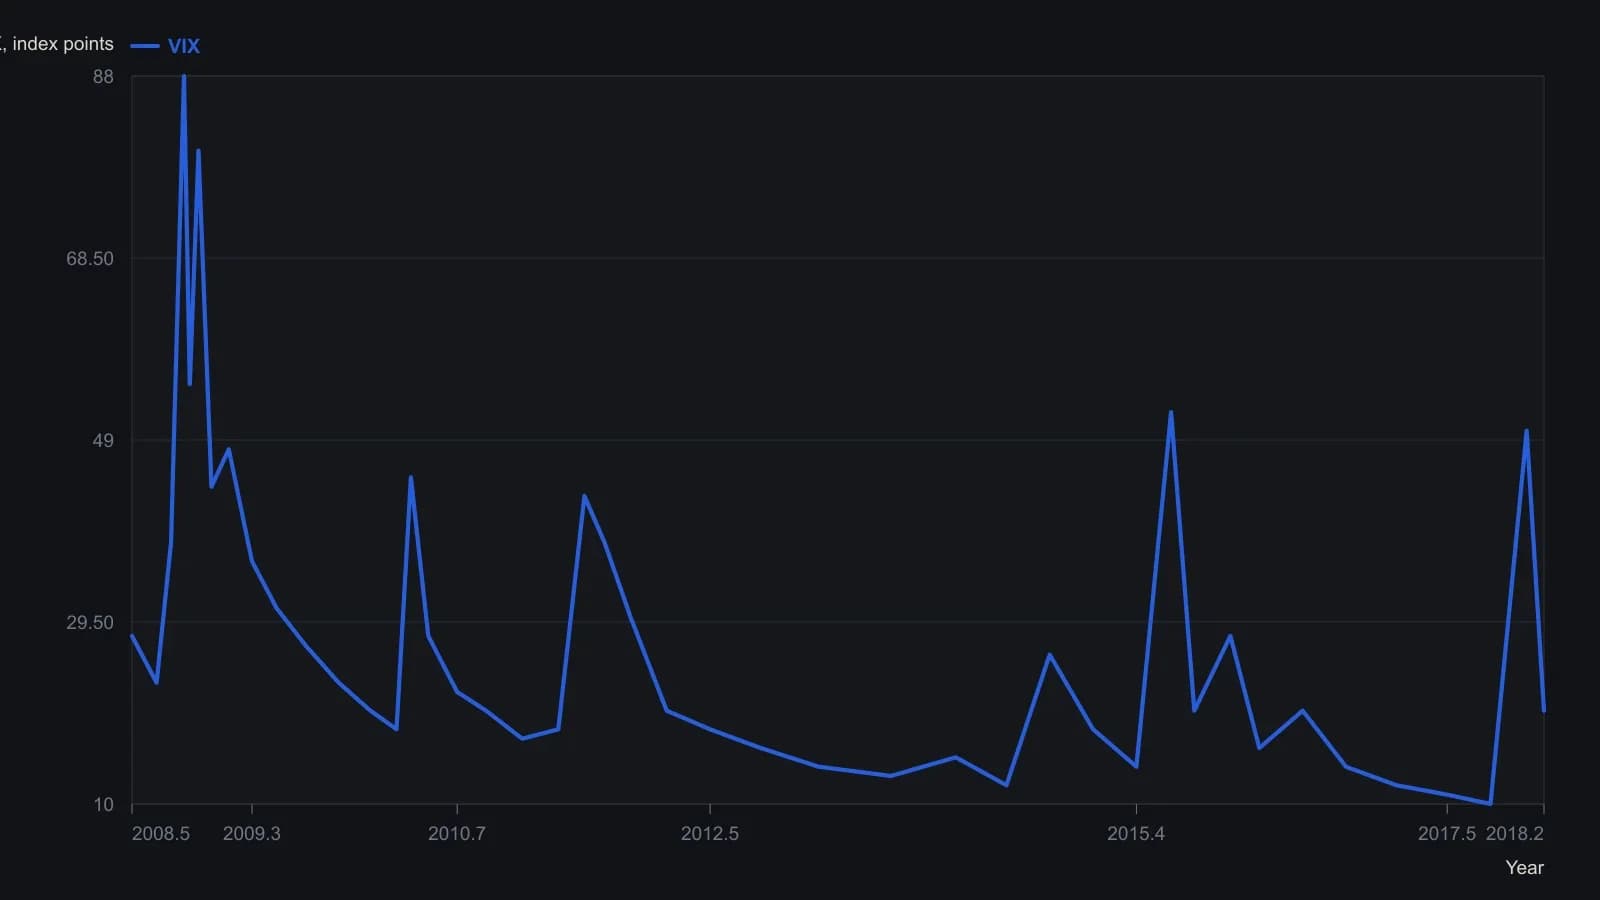
The March 2018 article smoothed VIX with a 10-week moving average in order to follow the trend rather than isolated spikes; this Cboe print is the unsmoothed index the letter cites, and the raster supports only about point-level precision.
Lookback-priming and the first complete value
A 10-quarter moving-average needs 2.5 years before the first complete value, so a study dated from 2000 must either prime with earlier observations or delay recording until later quarters.
Editorial reading: that choice is lookback-priming, whether a long window is filled with pre-sample observations or left incomplete until enough in-sample bars exist. Without stating which path was used, the first plotted regime cannot be read from the study label alone.
The entry without a matching exit
A sector-rotation results table left unclear whether yearly momentum-strategy cells were quarterly averages or full-year changes, and only some columns lined up with the maximum-drawdown row.
The stated rank-rotation entry bought a ranked exchange-traded fund only when it stood above its moving-average, while the matching exit was not specified. Rank-rotation orders candidate sectors or funds and allocates to the higher-ranked names under stated market-state rules. A momentum-strategy is a relative-strength signal set whose entries, exits, and abstentions must be specified together to be testable.
Editorial reading: the procedure is not auditable until the exit is written with the same care as the entry. A table that cannot be read as quarterly averages or as full-year changes does not supply that missing rule.
All readings on this track · 39 readings
- 1987A mechanical rank-rotation sleeve for monthly fund leaders
- 1989Rank rotation in a five-name no-load sleeve
- 1990Cycle-tested five-year fund rank rotation
- 1991Blue-chip rank rotation by relative-strength-index slope
- 1992Currency rank rotation and intermarket timing
- 1992Rank rotation and relative strength for portfolio construction
- 1994MACD crossovers then short-horizon rank rotation
- 1994A comparable group-trend ledger from published ranks
- 1997Normalized yield rank rotation as a full portfolio procedure
- 1997Constructing an investor preference index from two capitalization-weighted series
- 1998Constructing anchored momentum from a centered average
- 2000Rank rotation, a stop-loss order, and Relative Strength Index in fund switching
- 2003A one-fund daily rank is a two-sleeve construction problem
- 2004Evaluate rank rotation only where persistence already exists
- 2004Sector fund rank rotation with regression and trailing stops
- 2006Evaluating equal-weight annual yield-rank rotation
- 2007Weekly preferred-symbol reselection for mechanical trend systems
- 2011Portfolio capacity and entry pacing for mechanical systems
- 2011Rank rotation as a testable ETF construction procedure
- 2011The inverse-Fisher stochastic is a forecast layer until the book rules can be disabled
- 2012An underwater stretch is a sizing test for rank rotation
- 2015Rule-based ETF rotation as one testable procedure
- 2015MACD crossover evaluation by trend rank rotation
- 2015Persistence and strength as one close-to-close switch
- 2015Evaluating rank rotation after a persistence screen
- 2016Evaluating an annual valuation rank rotation
- 2017A two-step yield and price rank rotation for a five-name sleeve
- 2018Smoothed volatility and the missing rank-rotation exit
- 2018A five-condition scorecard that ranks stocks and can refuse the trade
- 2018Small-cap growth sleeve eligibility with trend and rank rotation
- 2018Evaluating rank-rotation momentum across fund wrappers
- 2019Evaluating an annual equity-gold momentum rank rotation
- 2019Evaluating equity-gold momentum on funds versus indexes
- 2020How a signed comparative-strength oscillator is built for rank rotation
- 2020Which calendar clock changes a gold-versus-equity rotation test
- 2020Four-dimension relative strength as rank rotation
- 2020Portfolio construction as a ranked relative-strength problem
- 2020Two clocks for a Nasdaq put/call sleeve
- 2020Rank, filter, and stop the hedge sleeve as one procedure