1994issue C031-16
MACD crossovers then short-horizon rank rotation
A usable timing model is specified as a few frequent, market-sensible rules so the signal can be statistically evaluated rather than read as a subjective chart. After that appraisal is already positive, Rank rotation uses short-horizon relative strength to select names still rising toward the top.
- The design goal is to objectify a timing signal so a method can be statistically evaluated rather than treated as a subjective chart reading.
- A usable model is a combination of a few frequent, market-sensible rules, with five or six frequently occurring rules given as a reasonable size, not a large stack added to cover leftover cases.
- Opening thrust is classified by how far a short moving average of a composite index stands above a 10-week moving average. MACD supplies the warning when a later price peak is unconfirmed or the gap narrows, and a moving average of that gap is the crossover signal.
- After the market-timing appraisal is already positive, longer-horizon ranking only screens names in about the top 20% to 30%, and Rank rotation on one-week or three-week relative strength selects those still rising toward the top.
Why the signal is written as rules
The design goal is to objectify a timing signal so a method can be statistically evaluated rather than treated as a subjective chart reading.
A usable model is specified as a combination of a few frequent, market-sensible rules, not a large stack added to cover leftover cases that fail the first rules. Five or six frequently occurring rules are given as a reasonable size for such a model.
Opening thrust
Opening thrust is classified by how far a short moving average of a composite index stands above a 10-week moving average. A larger initial displacement is treated as more likely to continue. A small displacement is treated as a reason to keep a shorter horizon.
MACD and the Moving-average crossover
MACD is defined as the expanding or contracting gap between a shorter-term and a longer-term exponential or front-weighted moving average applied to a market or indicator.
A later price peak that MACD does not confirm, or a narrowing of that gap, is treated as the warning. A moving average of the gap is used as the crossover signal.
Faster MACD length pairs are used for buy signals than for sell signals. Buy and sell parameters are tested separately because they are not assumed to match across markets.
Rank rotation after a positive appraisal
After the market-timing appraisal is already positive, names are ranked by one-week or three-week relative strength rather than by long-horizon top rank alone.
Longer-horizon ranking is used only as a screen for names in about the top 20% to 30%. Rank rotation on the short horizon then selects those still rising toward the top rather than already exhausted there.
NYSE 3-day advance-decline EMA, 1990–91
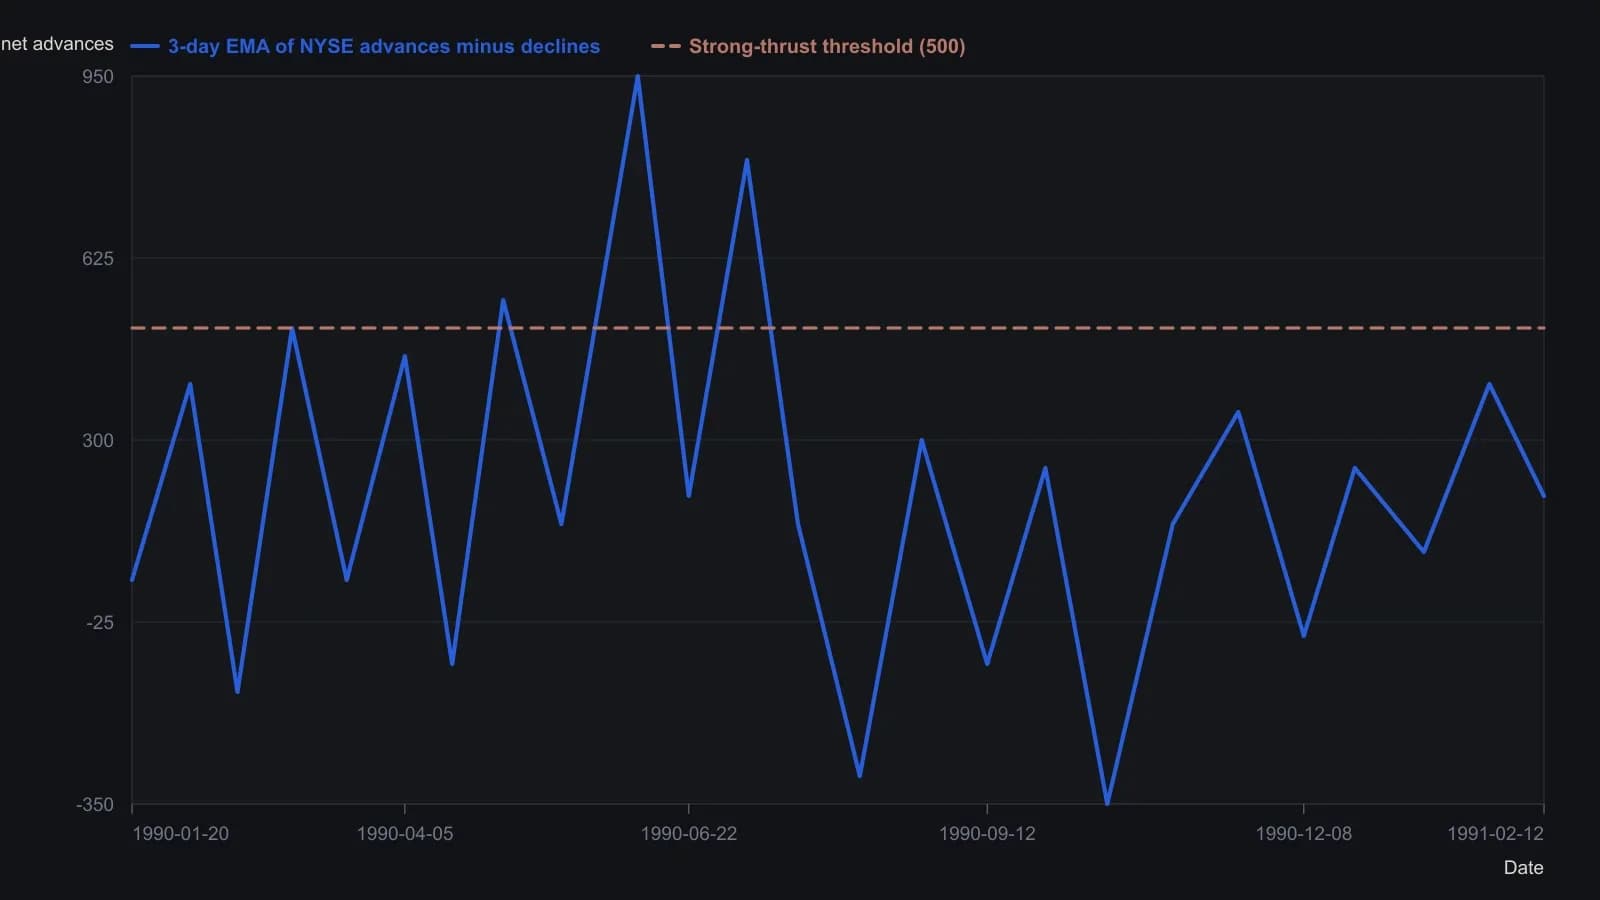
A photograph of a daily CRT chart: turning points are approximate to the nearest 50 net advances, and daily noise finer than the scan was not filled in. Appel treats 300–400 as only an average 4–5 percent swing and 600 net declines as a durable down move.
All readings on this track · 39 readings
- 1987A mechanical rank-rotation sleeve for monthly fund leaders
- 1989Rank rotation in a five-name no-load sleeve
- 1990Cycle-tested five-year fund rank rotation
- 1991Blue-chip rank rotation by relative-strength-index slope
- 1992Currency rank rotation and intermarket timing
- 1992Rank rotation and relative strength for portfolio construction
- 1994MACD crossovers then short-horizon rank rotation
- 1994A comparable group-trend ledger from published ranks
- 1997Normalized yield rank rotation as a full portfolio procedure
- 1997Constructing an investor preference index from two capitalization-weighted series
- 1998Constructing anchored momentum from a centered average
- 2000Rank rotation, a stop-loss order, and Relative Strength Index in fund switching
- 2003A one-fund daily rank is a two-sleeve construction problem
- 2004Evaluate rank rotation only where persistence already exists
- 2004Sector fund rank rotation with regression and trailing stops
- 2006Evaluating equal-weight annual yield-rank rotation
- 2007Weekly preferred-symbol reselection for mechanical trend systems
- 2011Portfolio capacity and entry pacing for mechanical systems
- 2011Rank rotation as a testable ETF construction procedure
- 2011The inverse-Fisher stochastic is a forecast layer until the book rules can be disabled
- 2012An underwater stretch is a sizing test for rank rotation
- 2015Rule-based ETF rotation as one testable procedure
- 2015MACD crossover evaluation by trend rank rotation
- 2015Persistence and strength as one close-to-close switch
- 2015Evaluating rank rotation after a persistence screen
- 2016Evaluating an annual valuation rank rotation
- 2017A two-step yield and price rank rotation for a five-name sleeve
- 2018Smoothed volatility and the missing rank-rotation exit
- 2018A five-condition scorecard that ranks stocks and can refuse the trade
- 2018Small-cap growth sleeve eligibility with trend and rank rotation
- 2018Evaluating rank-rotation momentum across fund wrappers
- 2019Evaluating an annual equity-gold momentum rank rotation
- 2019Evaluating equity-gold momentum on funds versus indexes
- 2020How a signed comparative-strength oscillator is built for rank rotation
- 2020Which calendar clock changes a gold-versus-equity rotation test
- 2020Four-dimension relative strength as rank rotation
- 2020Portfolio construction as a ranked relative-strength problem
- 2020Two clocks for a Nasdaq put/call sleeve
- 2020Rank, filter, and stop the hedge sleeve as one procedure