2004issue C091-3
Full-window evaluation of crossover trend systems
Treat a moving-average crossover as one trend-following procedure by scoring in-market intervals and cash intervals inside the same test window, so the comparison is not limited to the years the rules held a position.
- Evaluate a moving-average crossover as trend following only when in-market intervals and cash intervals stay inside the same test window.
- Scoring a crossover only over the years it held positions can overstate improvement versus a continuously invested benchmark.
- The abstention rule is part of the procedure under test, not an adjustment applied after the backtest is finished.
- Once cash years were counted at a zero return, the full-window result of the crossover matched the always-invested alternative.
Score the whole procedure
A moving-average crossover is a signal rule that changes exposure when a shorter average of price crosses a longer average. Trend following is a single testable procedure that enters, holds, or stands aside from a market condition over the system holding period.
A moving-average crossover should be evaluated as a trend-following procedure only when both in-market and out-of-market intervals stay inside the same test window. The in-market interval is the part of a test window during which the rules keep a position open. The cash interval is the part of a test window during which the rules hold no market position.
Why a partial window can overstate improvement
Scoring a crossover only over the years it held positions can overstate improvement versus a continuously invested benchmark. A continuously invested benchmark is a comparison series that remains fully allocated for the entire sample.
The crossover's abstention rule is part of the procedure under test, not an adjustment applied after the backtest is finished.
A full-window comparison
In an 84-year comparison of a simple moving-average crossover with a continuously invested alternative, the crossover was in the market for 49.8 years and held cash for 34.2 years. Once those cash years were counted at a zero return, the full-window result of the crossover matched the always-invested alternative.
Interest on idle cash
Treating idle cash as able to earn a short-term interest return changes the evaluation, but only after interest-rate variation and transaction costs are considered.
Crossover yield versus buy-and-hold on the full 84-year window
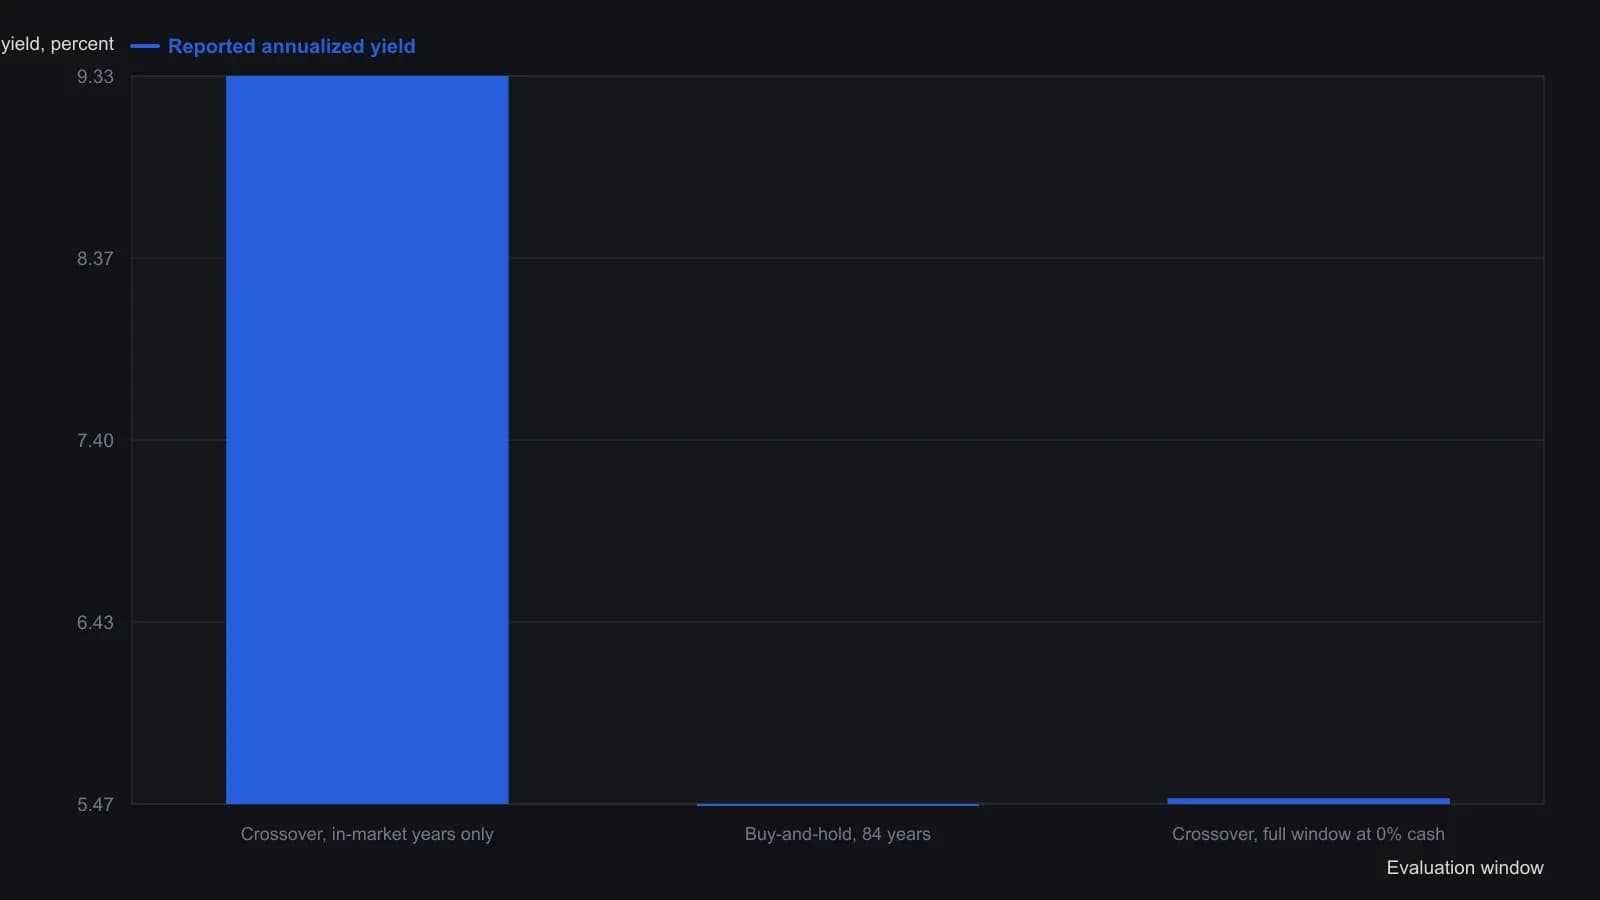
Idle cash is scored at a zero yield, which is the letter's baseline before any Treasury or savings interest. The 5.5 percent full-window pair is Cohen's rounded restatement of that same 84-year stretch.
All readings on this track · 57 readings
- 1988Constructing moving averages: weights, smoothing and crossovers
- 1988Constructing breadth and average trend states
- 1989Evaluating an always-in-the-market moving-average crossover
- 1989Constructing symmetric market-breadth ratio accumulators
- 1989Objective crossover tests of Fibonacci wave ratios
- 1990Volume-adjusted moving average construction
- 1991Constructing a mechanical crossover on a synthetic price series
- 1991A two-speed breadth reading for intermediate market direction
- 1992A Deutschemark yield map with dual-average and relative-strength timing
- 1992Confirming currency-fund trends with a crossover and a filter
- 1992A moving-average slope filter for crossover signals
- 1992Occupancy and split-sample tests for average crossovers
- 1994Gold-mining seasonality and bond-fund duration switching
- 1994Price oscillator from two moving averages
- 1995Explicit exponential weights and binary entry filters
- 1996Currency futures crossover with slope, bond filter, and stop
- 1996Two-market average crossover entry with a fixed stop
- 1997Construction of a filtered three-average crossover
- 1998Two-group exponential average compression as a trend filter
- 1998Constructing r-squared trend filters with dual lookbacks
- 1998Moving-average length is a habit, not a secret
- 1999Solving the close that triggers a moving-average crossover
- 2000Kagi yang and yin control versus crossover noise
- 2000Constructing simple moving average crossover filters
- 2000Building a vertical-horizontal filter to gate trend signals
- 2000Two-average crossover as a check on trend following
- 2003Stacked exponential-average retracement entries and extreme stops
- 2003Evaluating oscillator thresholds against optimized crossovers
- 2004Constructing a semicycle trend-quality filter
- 2004Commodity subgroups labeled by crossover, support, or convergence
- 2004Full-window evaluation of crossover trend systems
- 2004Two-average trend filters as a classroom critique of indicator stacking
- 2005Three-layer confirmation from a moving-average cross, candles, and Q-stick
- 2005Charting put prices beside an equity breakdown
- 2005Range-gated moving-average crossover construction
- 2007Anticipating a simple-average crossover with a threshold-close
- 2007Anticipating moving-average crossovers one bar ahead
- 2007Lead-series moving-average crossovers with a stochastic and relative strength index
- 2007Next-bar SMA crossover hypotheses from theoretical crossing values
- 2007Anticipating a moving-average crossover before confirmation
- 2007A three-horizon moving-average stack as a construction problem
- 2007Confirming trend with regression slope and r-squared
- 2008Constructing a multi-timeframe smoothed crossover
- 2008Best-day clusters versus trend filters
- 2008Allied markets as a confirmation gate for crossover and breakout signals
- 2008Weekly exponential-average crossover as a mechanical trend case study
- 2010Evaluating a 200-day crossover as long, short, and stand-aside rules
- 2010Read a 10-and-40 trend on two neighboring time frames
- 2012Sampling unit as a first-class parameter on dual simple moving averages
- 2012Constructing index-ETF entries from volatility-index persistence
- 2013Moving-average baselines versus crossover signals
- 2013Constructing a typical-price and heikin-ashi crossover as one mechanical procedure
- 2016A three-gate checklist for longs after a sharp drop
- 2016Weekly inflation-ratio crossover for commodity regimes
- 2017Normalized Laguerre zero-axis warning as a two-marker construction
- 2019Range-weighted construction of an adaptive exponential moving average
- 2020Construct a second-pullback entry after a moving-average crossover