1989issue C121-7
Objective crossover tests of Fibonacci wave ratios
Fibonacci retracement and Elliott wave analysis treat limits near 0.618 and 1.618 as expected fractions of a prior swing. In the historical workflow, upwaves and downwaves were locked from local extremes between moving-average crossovers, then wave ratios were measured on Dow Jones Industrial Average prices through January 30, 1986. None of those crossover-defined means equaled 1.618, and every moving-average length showed large dispersion.
- After the first four Fibonacci-sequence pairs, successive ratios cluster near 0.618 and inverse pairs cluster near 1.618.
- Upwaves and downwaves were defined from local extremes between moving-average crossovers so trend turns did not depend on discretionary labeling.
- For 10-day crossovers, a two-tailed test rejected a mean of 1.618 at the 1% level for total-advance-to-net-advance and advancing-to-declining days, and at the 5% level for total advances versus total declines.
- None of the crossover-defined wave-ratio means equaled 1.618, and every moving-average length showed large dispersion with standard deviations on the order of the respective means.
Ratios treated as expected fractions
Fibonacci retracement uses Fibonacci-sequence proportions, especially the limits near 0.618 and 1.618, as expected fractions of a prior price swing. After the first four Fibonacci-sequence pairs, successive ratios cluster near 0.618 and inverse pairs cluster near 1.618.
Elliott wave analysis is a self-similar count of five-wave impulses and three-wave corrections applied at more than one time scale. A recursively subdivided five-up and three-down wave count would be expected to produce ratios near 0.618 if that self-similar structure described prices.
The golden ratio is that limiting Fibonacci value near 0.618, with inverse near 1.618, treated as a testable mean for wave ratios rather than a chart decoration.
A cited split near the limit
One cited split of 8143 bull-market days against 4972 bear-market days equals 0.611, near 0.618, while a single cited primary-swing ratio of 1.621 was not matched by the other eight bull markets in that set.
Editorial reading: one day-count split near 0.618, and one primary-swing ratio near 1.618, do not show that those constants are general wave-ratio means.
Waves locked by crossovers
A moving-average crossover is a trend-turn rule that labels an upwave or downwave from the local extreme between index crossings of a moving average. Upwaves and downwaves were defined from local extremes between moving-average crossovers so trend turns did not depend on discretionary labeling.
A wave ratio is a measured comparison inside a defined wave, such as advancing days to declining days or total advance to total decline. Wave statistics were computed on Dow Jones Industrial Average prices through January 30, 1986 across moving-average lengths of 5, 10, 15, 20, 25, 30, 35, 40, 45, 50, 60, 70, 80, 90, and 100 days.
Tests of a 1.618 mean
For 10-day crossovers, a two-tailed test rejected a mean of 1.618 at the 1% level for total-advance-to-net-advance and advancing-to-declining days, and at the 5% level for total advances versus total declines.
For 20- and 30-day crossovers the same 1.618 mean generally could not be rejected at the 1% level, except that the 20-day total-advance-to-net-advance ratio could be rejected at the 10% level.
None of the crossover-defined wave-ratio means equaled 1.618, and every moving-average length showed large dispersion with standard deviations on the order of the respective means.
Subwaves in two 1985 intervals
Inside the September 18, 1985 to January 7, 1986 advance, 10-day subwave advance/decline ratios were 2.534, 2.982, 5.903, and 2.758, with 50 advancing versus 26 declining days and a total-advance-to-net-advance ratio of 1.338.
In the June 20, 1985 to September 18, 1985 interval there were 35 advancing and 26 declining days, and the average advance of 4.606 points versus the average decline of 6.108 gave a ratio of 0.754.
Crossover-defined DJIA wave ratios against 1.618
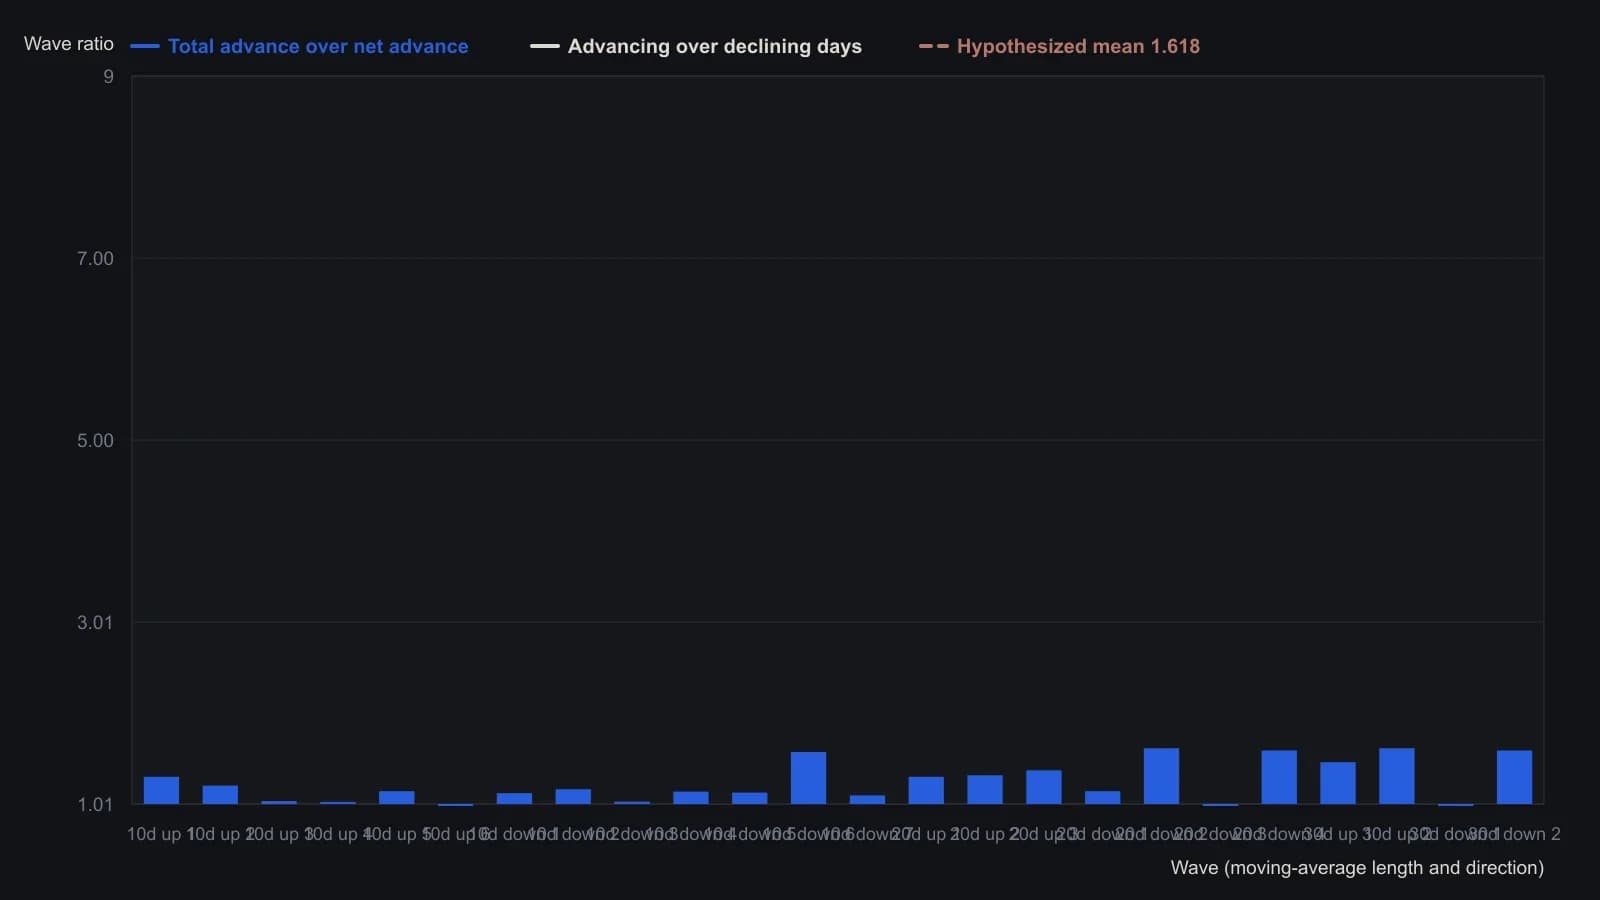
Down-wave entries already use the reciprocal form (declining over advancing) so both directions can be compared with 1.618. The 20- and 30-day samples are small; the author treated failure to reject 1.618 there as a sample-size issue, not as support for a Fibonacci mean.
All readings on this track · 57 readings
- 1988Constructing moving averages: weights, smoothing and crossovers
- 1988Constructing breadth and average trend states
- 1989Evaluating an always-in-the-market moving-average crossover
- 1989Constructing symmetric market-breadth ratio accumulators
- 1989Objective crossover tests of Fibonacci wave ratios
- 1990Volume-adjusted moving average construction
- 1991Constructing a mechanical crossover on a synthetic price series
- 1991A two-speed breadth reading for intermediate market direction
- 1992A Deutschemark yield map with dual-average and relative-strength timing
- 1992Confirming currency-fund trends with a crossover and a filter
- 1992A moving-average slope filter for crossover signals
- 1992Occupancy and split-sample tests for average crossovers
- 1994Gold-mining seasonality and bond-fund duration switching
- 1994Price oscillator from two moving averages
- 1995Explicit exponential weights and binary entry filters
- 1996Currency futures crossover with slope, bond filter, and stop
- 1996Two-market average crossover entry with a fixed stop
- 1997Construction of a filtered three-average crossover
- 1998Two-group exponential average compression as a trend filter
- 1998Constructing r-squared trend filters with dual lookbacks
- 1998Moving-average length is a habit, not a secret
- 1999Solving the close that triggers a moving-average crossover
- 2000Kagi yang and yin control versus crossover noise
- 2000Constructing simple moving average crossover filters
- 2000Building a vertical-horizontal filter to gate trend signals
- 2000Two-average crossover as a check on trend following
- 2003Stacked exponential-average retracement entries and extreme stops
- 2003Evaluating oscillator thresholds against optimized crossovers
- 2004Constructing a semicycle trend-quality filter
- 2004Commodity subgroups labeled by crossover, support, or convergence
- 2004Full-window evaluation of crossover trend systems
- 2004Two-average trend filters as a classroom critique of indicator stacking
- 2005Three-layer confirmation from a moving-average cross, candles, and Q-stick
- 2005Charting put prices beside an equity breakdown
- 2005Range-gated moving-average crossover construction
- 2007Anticipating a simple-average crossover with a threshold-close
- 2007Anticipating moving-average crossovers one bar ahead
- 2007Lead-series moving-average crossovers with a stochastic and relative strength index
- 2007Next-bar SMA crossover hypotheses from theoretical crossing values
- 2007Anticipating a moving-average crossover before confirmation
- 2007A three-horizon moving-average stack as a construction problem
- 2007Confirming trend with regression slope and r-squared
- 2008Constructing a multi-timeframe smoothed crossover
- 2008Best-day clusters versus trend filters
- 2008Allied markets as a confirmation gate for crossover and breakout signals
- 2008Weekly exponential-average crossover as a mechanical trend case study
- 2010Evaluating a 200-day crossover as long, short, and stand-aside rules
- 2010Read a 10-and-40 trend on two neighboring time frames
- 2012Sampling unit as a first-class parameter on dual simple moving averages
- 2012Constructing index-ETF entries from volatility-index persistence
- 2013Moving-average baselines versus crossover signals
- 2013Constructing a typical-price and heikin-ashi crossover as one mechanical procedure
- 2016A three-gate checklist for longs after a sharp drop
- 2016Weekly inflation-ratio crossover for commodity regimes
- 2017Normalized Laguerre zero-axis warning as a two-marker construction
- 2019Range-weighted construction of an adaptive exponential moving average
- 2020Construct a second-pullback entry after a moving-average crossover