2004issue C041-3
Constructing a semicycle trend-quality filter
A two-stage trend filter first cuts price into directed up and down semicycles with a small pair of exponential averages, then grades each stretch by how far measured trend exceeds estimated noise.
- The moving-average crossover is a segmentation rule that starts and ends directed semicycles, not a standalone trade.
- Each semicycle is graded by how far measured trend exceeds estimated noise, not by which average sits on top.
- The Q-indicator is a centered trend-to-noise oscillator; the B-indicator reports whether a trend exists and how strong it is on a zero-to-100 scale and still needs a separate reversal tool.
- Averaging-period choice is a sensitivity tradeoff between tracking price closely and reducing false reversals.
Two stages, not one signal
This archive note reconstructs a two-stage trend filter. The first stage is a moving-average filter limited to a small set of term-oriented averaging periods. That filter marks reversal points and the up and down semicycles that follow. The second stage scores whether the extracted trend looks promising and how strong it is.
A semicycle is the directed stretch of price between two successive moving-average reversal points. Exponential smoothing supplies the averages: a recursively weighted average applied to price, or later to cumulative price change, so recent observations dominate the extracted trend.
How semicycles are cut
Semicycle start points can be defined with a moving-average crossover, the rule that marks where a shorter and a longer average exchange rank. In this construction the crossover is used only to start and end semicycles.
Averaging-period choice is a sensitivity tradeoff. A shorter period tracks price more closely but admits more random fluctuations. A longer period lags current prices and reduces false reversals.
Trend inside the segment
Cumulative price change from that start is the running sum of successive price differences. The trend inside the semicycle is a moving average of that cumulative series after the start.
Noise and the Q-indicator
Noise is an n-period average of the absolute gap between cumulative price change and trend, or the root-mean-square of that gap. The noise lookback n is specified to be longer than the trend lookback m.
The Q-indicator is a centered oscillator formed by dividing the semicycle trend by a noise estimate and applying a correction factor. Strength is expressed relative to background fluctuation rather than as an absolute price move.
Published Q-indicator bands treat absolute readings at or below 1 as trend buried in noise, 1 to 2 as weak, 2 to 5 as moderate, and beyond 5 as strong. Readings past the strong band are described as stretched conditions that warrant closer monitoring.
The B-indicator
The B-indicator is a 0-to-100 banded oscillator equal to the absolute trend divided by the sum of absolute trend and noise, then scaled by 100. It reports whether a trend exists and how strong it is, not its direction, so a separate reversal tool is required.
Interpretation places equilibrium, where trend equals noise, at the center line. Weak trending sits in the 50-65 band, moderate trending in 65-80, and strong trending above 80. The value 65 is used as a cutoff between trending and ranging conditions.
Short-horizon and long-horizon illustrations
Worked illustrations construct a short-horizon Q-indicator from a 7-day and 15-day exponential moving-average crossover, and a long-horizon B-indicator from a 10-week and 40-week exponential moving-average crossover.
Editorial: those pairs are presented as fixed, term-oriented choices, one short and one long, rather than as a search across many averaging periods.
Citrix short-term Q-indicator, Aug 2002–May 2003
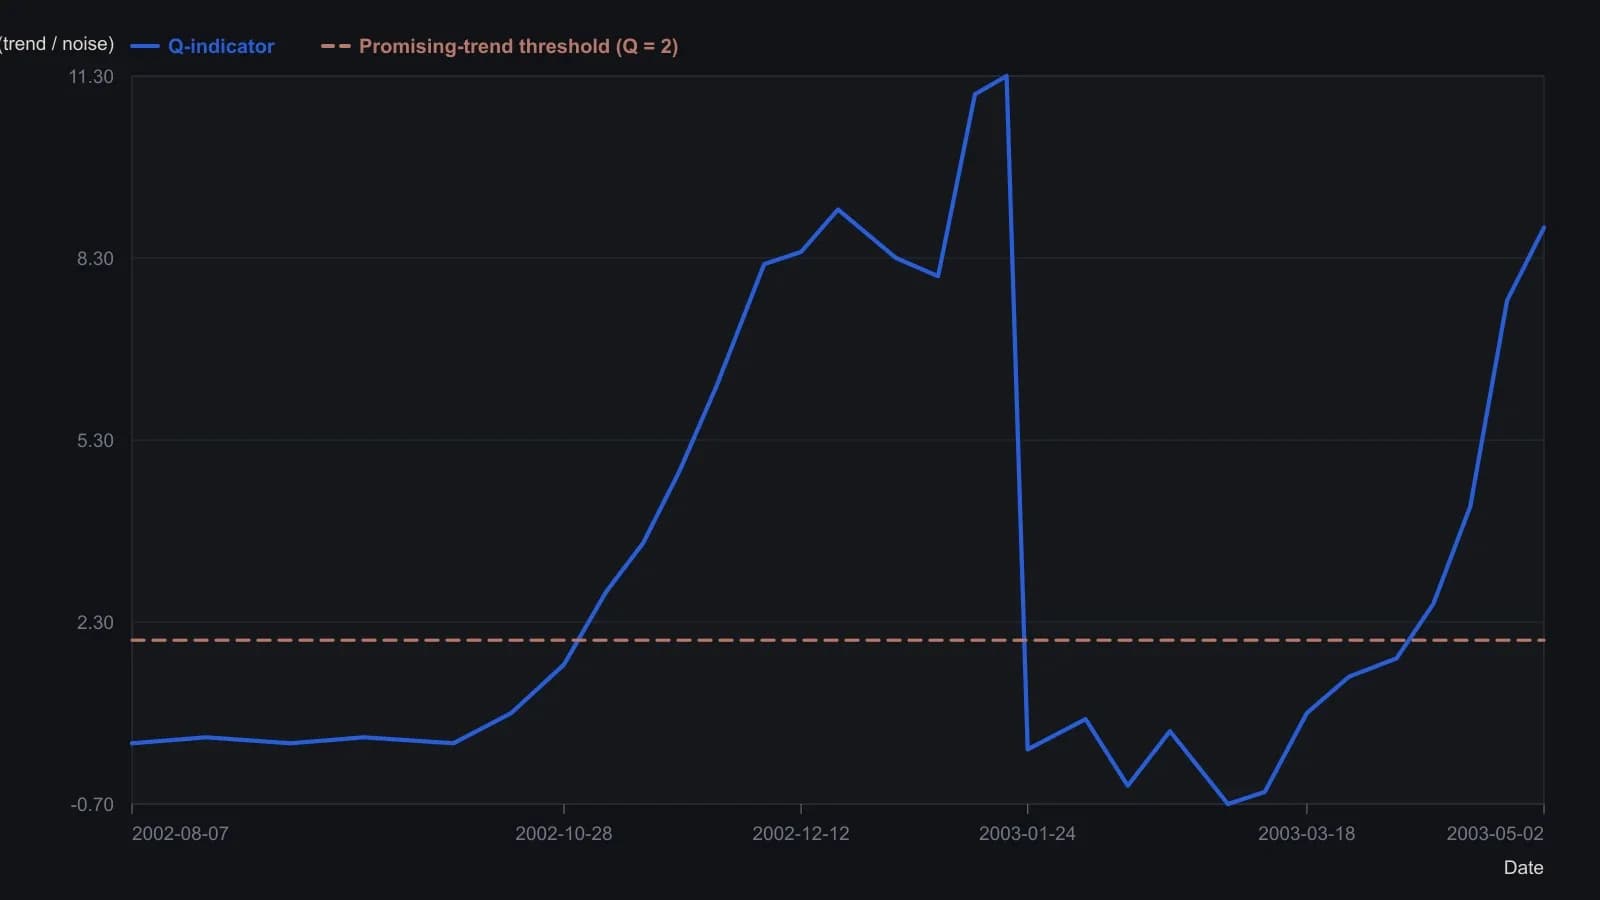
Digitized from the plotted Q histogram. Semicycles come from the 7-day and 15-day EMA crossover named in the figure. y is approximate to about half a Q unit. The +2 line is the article’s cutoff for a promising trend.
All readings on this track · 57 readings
- 1988Constructing moving averages: weights, smoothing and crossovers
- 1988Constructing breadth and average trend states
- 1989Evaluating an always-in-the-market moving-average crossover
- 1989Constructing symmetric market-breadth ratio accumulators
- 1989Objective crossover tests of Fibonacci wave ratios
- 1990Volume-adjusted moving average construction
- 1991Constructing a mechanical crossover on a synthetic price series
- 1991A two-speed breadth reading for intermediate market direction
- 1992A Deutschemark yield map with dual-average and relative-strength timing
- 1992Confirming currency-fund trends with a crossover and a filter
- 1992A moving-average slope filter for crossover signals
- 1992Occupancy and split-sample tests for average crossovers
- 1994Gold-mining seasonality and bond-fund duration switching
- 1994Price oscillator from two moving averages
- 1995Explicit exponential weights and binary entry filters
- 1996Currency futures crossover with slope, bond filter, and stop
- 1996Two-market average crossover entry with a fixed stop
- 1997Construction of a filtered three-average crossover
- 1998Two-group exponential average compression as a trend filter
- 1998Constructing r-squared trend filters with dual lookbacks
- 1998Moving-average length is a habit, not a secret
- 1999Solving the close that triggers a moving-average crossover
- 2000Kagi yang and yin control versus crossover noise
- 2000Constructing simple moving average crossover filters
- 2000Building a vertical-horizontal filter to gate trend signals
- 2000Two-average crossover as a check on trend following
- 2003Stacked exponential-average retracement entries and extreme stops
- 2003Evaluating oscillator thresholds against optimized crossovers
- 2004Constructing a semicycle trend-quality filter
- 2004Commodity subgroups labeled by crossover, support, or convergence
- 2004Full-window evaluation of crossover trend systems
- 2004Two-average trend filters as a classroom critique of indicator stacking
- 2005Three-layer confirmation from a moving-average cross, candles, and Q-stick
- 2005Charting put prices beside an equity breakdown
- 2005Range-gated moving-average crossover construction
- 2007Anticipating a simple-average crossover with a threshold-close
- 2007Anticipating moving-average crossovers one bar ahead
- 2007Lead-series moving-average crossovers with a stochastic and relative strength index
- 2007Next-bar SMA crossover hypotheses from theoretical crossing values
- 2007Anticipating a moving-average crossover before confirmation
- 2007A three-horizon moving-average stack as a construction problem
- 2007Confirming trend with regression slope and r-squared
- 2008Constructing a multi-timeframe smoothed crossover
- 2008Best-day clusters versus trend filters
- 2008Allied markets as a confirmation gate for crossover and breakout signals
- 2008Weekly exponential-average crossover as a mechanical trend case study
- 2010Evaluating a 200-day crossover as long, short, and stand-aside rules
- 2010Read a 10-and-40 trend on two neighboring time frames
- 2012Sampling unit as a first-class parameter on dual simple moving averages
- 2012Constructing index-ETF entries from volatility-index persistence
- 2013Moving-average baselines versus crossover signals
- 2013Constructing a typical-price and heikin-ashi crossover as one mechanical procedure
- 2016A three-gate checklist for longs after a sharp drop
- 2016Weekly inflation-ratio crossover for commodity regimes
- 2017Normalized Laguerre zero-axis warning as a two-marker construction
- 2019Range-weighted construction of an adaptive exponential moving average
- 2020Construct a second-pullback entry after a moving-average crossover