2010issue C0394-97
Evaluating a 200-day crossover as long, short, and stand-aside rules
A 200-day moving-average crossover on the S&P 500 was kept as one chart rule and then graded as three mechanical procedures: a long-or-short book, a long-only book, and a cash stand-aside rule. The archive treated that rule as a limited piece of a long-term trend model, not as a complete trend-following solution.
- The same 200-day moving-average crossover was logged as a mechanical long-or-short procedure and then rewritten as a stand-aside rule that held three-month Treasury bills after a downward cross.
- Each crossover record listed the date, the index level, the moving-average level, and a binary long or short flag.
- The stand-aside design was tied to lower beta and smaller drawdowns, and to spending about one-third of the sample with no equity-index exposure, not to beating a dividend-inclusive buy-and-hold on total return.
- The closing assessment gave the 200-day crossover limited use inside a long-term trend model and said it should be combined with other forecasting tools.
One chart rule, three procedures
A 200-day moving-average crossover was specified as a mechanical long-or-short procedure on the S&P 500. The same rule was tabulated calendar year by calendar year from 1970 through 2009 beside the index for those years.
A moving-average crossover is a repeatable flip between long and short when an index moves through a fixed-length average of its own past levels. Trend following stays aligned with the latest accepted direction rather than forecasting a reversal. A mechanical trading system is a complete, replayable set of entry, exit, and abstention rules tested as one procedure.
What the crossover log recorded
Each logged crossover recorded the date, the index level, the moving-average level, and a binary position flag of long or short. That log is what made the chart condition replayable as one mechanical trading system instead of a loose market story.
From short signal to stand-aside rule
A short signal is a downward cross that, in the base test, reversed the book from long to short. Short signals from that same 200-day rule were judged counterproductive.
A stand-aside rule is a substitution that parks the book in a cash-like instrument instead of taking the short side. The second mechanical variant stayed long the index after an upward cross and moved into that day's three-month Treasury bill after a downward cross.
How the stand-aside book was judged
The stand-aside variant was described as spending about one-third of the sample with no equity-index exposure. The evaluation tied that design to lower beta and smaller drawdowns rather than to beating a dividend-inclusive buy-and-hold on total return.
A risk-adjusted comparison judges a system by time in the market, path of losses, and exposure, not only by compounded total return.
The Treasury-bill variant's worst cited calendar year was 1990. That year was used as a benchmark against several worse buy-and-hold years in the same annual comparison.
Annual returns of a 200-day S&P 500 crossover, stand-aside versus long-or-short versus buy-and-hold
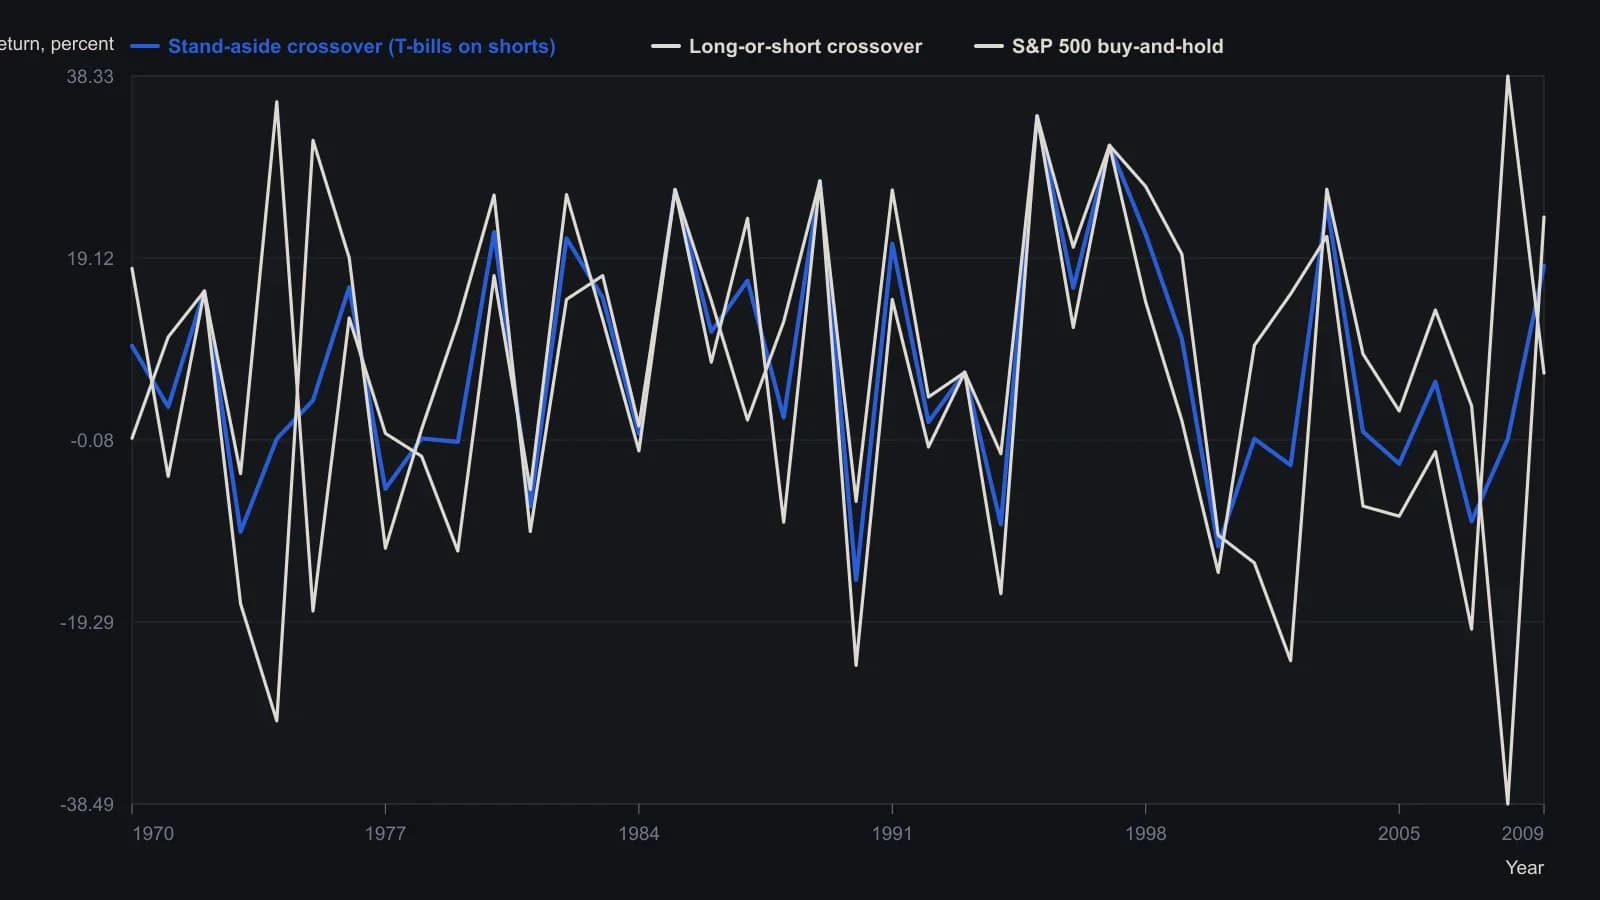
On a short crossover the stand-aside book held that day's three-month Treasury bill instead of shorting the index. The source reported a 9.2 percent average annual return for that variant, below buy-and-hold plus dividends.
Limited use inside a trend model
The closing assessment treated the 200-day crossover as having limited use inside a long-term trend model, not as a complete trend-following solution. It said the rule should be combined with other forecasting tools.
All readings on this track · 57 readings
- 1988Constructing moving averages: weights, smoothing and crossovers
- 1988Constructing breadth and average trend states
- 1989Evaluating an always-in-the-market moving-average crossover
- 1989Constructing symmetric market-breadth ratio accumulators
- 1989Objective crossover tests of Fibonacci wave ratios
- 1990Volume-adjusted moving average construction
- 1991Constructing a mechanical crossover on a synthetic price series
- 1991A two-speed breadth reading for intermediate market direction
- 1992A Deutschemark yield map with dual-average and relative-strength timing
- 1992Confirming currency-fund trends with a crossover and a filter
- 1992A moving-average slope filter for crossover signals
- 1992Occupancy and split-sample tests for average crossovers
- 1994Gold-mining seasonality and bond-fund duration switching
- 1994Price oscillator from two moving averages
- 1995Explicit exponential weights and binary entry filters
- 1996Currency futures crossover with slope, bond filter, and stop
- 1996Two-market average crossover entry with a fixed stop
- 1997Construction of a filtered three-average crossover
- 1998Two-group exponential average compression as a trend filter
- 1998Constructing r-squared trend filters with dual lookbacks
- 1998Moving-average length is a habit, not a secret
- 1999Solving the close that triggers a moving-average crossover
- 2000Kagi yang and yin control versus crossover noise
- 2000Constructing simple moving average crossover filters
- 2000Building a vertical-horizontal filter to gate trend signals
- 2000Two-average crossover as a check on trend following
- 2003Stacked exponential-average retracement entries and extreme stops
- 2003Evaluating oscillator thresholds against optimized crossovers
- 2004Constructing a semicycle trend-quality filter
- 2004Commodity subgroups labeled by crossover, support, or convergence
- 2004Full-window evaluation of crossover trend systems
- 2004Two-average trend filters as a classroom critique of indicator stacking
- 2005Three-layer confirmation from a moving-average cross, candles, and Q-stick
- 2005Charting put prices beside an equity breakdown
- 2005Range-gated moving-average crossover construction
- 2007Anticipating a simple-average crossover with a threshold-close
- 2007Anticipating moving-average crossovers one bar ahead
- 2007Lead-series moving-average crossovers with a stochastic and relative strength index
- 2007Next-bar SMA crossover hypotheses from theoretical crossing values
- 2007Anticipating a moving-average crossover before confirmation
- 2007A three-horizon moving-average stack as a construction problem
- 2007Confirming trend with regression slope and r-squared
- 2008Constructing a multi-timeframe smoothed crossover
- 2008Best-day clusters versus trend filters
- 2008Allied markets as a confirmation gate for crossover and breakout signals
- 2008Weekly exponential-average crossover as a mechanical trend case study
- 2010Evaluating a 200-day crossover as long, short, and stand-aside rules
- 2010Read a 10-and-40 trend on two neighboring time frames
- 2012Sampling unit as a first-class parameter on dual simple moving averages
- 2012Constructing index-ETF entries from volatility-index persistence
- 2013Moving-average baselines versus crossover signals
- 2013Constructing a typical-price and heikin-ashi crossover as one mechanical procedure
- 2016A three-gate checklist for longs after a sharp drop
- 2016Weekly inflation-ratio crossover for commodity regimes
- 2017Normalized Laguerre zero-axis warning as a two-marker construction
- 2019Range-weighted construction of an adaptive exponential moving average
- 2020Construct a second-pullback entry after a moving-average crossover