1988issue C061-3
Constructing breadth and average trend states
This editorial treats a trend call as a construction problem. The archive workflow writes the arithmetic first, from average stacks and group bull-versus-bear counts to a fitted residual between a price average and accumulated advances minus declines, then reads each finished state as a condition that can be marked true or false on a chart.
- A 10-period simple moving average changes only by the newest observation versus the one dropped from 11 periods earlier, while an exponential average is presented as easier to keep and more weighted to recent observations.
- Rising and falling states are defined by price versus an average, by a shorter average versus a longer one, or by a three-curve stack of last price, a 5-week exponential average, and a 19-week exponential average.
- Market breadth can be a group count of bullish versus bearish members, an accumulated advance-decline series set beside a price average, a 10-day non-cumulative oscillator, or a three-day net-advance mark.
- When a price average and a cumulative advance-decline series are not on the same scale, a least-squares line of the price average on the advance-decline series reports the percentage the price average sits above or below that line.
Keep the averages as arithmetic
A 10-period simple moving average is updated by adding the newest observation, dropping the observation from 11 periods earlier, and dividing by 10. The average’s change depends only on that newest-versus-dropped pair.
An exponential average is presented as easier to compute than a simple moving average and as giving more weight to recent observations.
Read price against one average or two
Price above a moving or exponential average is treated as a rising-trend condition. The average’s length sets whether the reading is short or long term. The crossover itself is treated as a possible buy or sell mark.
A shorter moving average above a longer one is treated as a rising long-horizon trend. The reverse alignment is treated as a falling trend. In the terms used here, that is a moving-average crossover: a trend state defined by price versus an average, or by a shorter average versus a longer one, with the lookback setting the horizon of the reading.
Daily price with declining channel, January–June
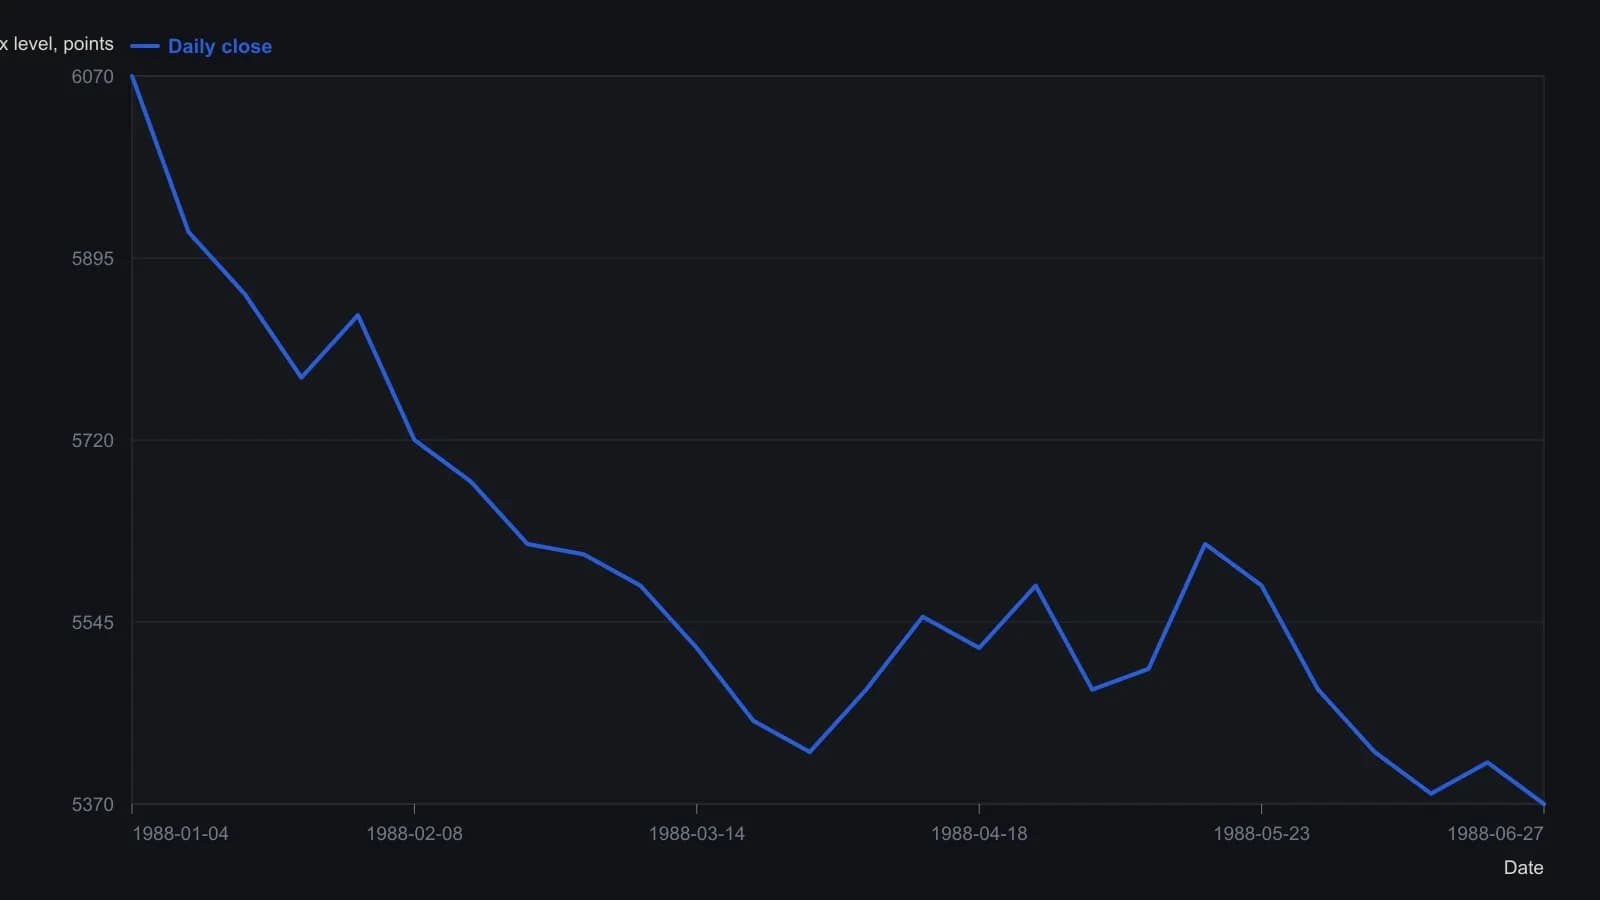
Closes digitized from the raster at about weekly spacing; y-scale ticks are 100 points. Channel and signal marks on the page were not digitized as separate series.
Stack last price with two exponential averages
One three-curve stack uses last price, a 5-week exponential average, and a 19-week exponential average. Price above the 5-week average and the 5-week average above the 19-week average is labeled bullish. The inverse stack is labeled bearish.
Count bullish and bearish members
Market breadth is a group reading built from how many issues advance, decline, or sit in a bullish versus bearish state, rather than from one price average alone.
For a watched group of stocks, the number of members classed as bullish can be compared with the number classed as bearish. Any of the discussed trend rules can label each member.
Fit a residual between price and breadth
Daily advances minus declines can be accumulated and set beside a market price average. A gap between the two series is treated as a signal that the trend may be changing.
Because a price average and a cumulative advance-decline series are not on the same scale, one construction fits a least-squares line of the price average on the advance-decline series and then reports the percentage the price average sits above or below that line. In the terms used here, that fitted line is linear regression: it relates a market price series to advance-decline statistics so the percentage gap between price and that line can be read as a divergence oscillator.
Use a short window or a three-day mark
A non-cumulative advance-decline alternative totals advances over 10 days and declines over 10 days to form an oscillator intended to make trend changes visible more quickly than a running sum.
A three-day net-advance rule places an up mark after three consecutive sessions with advances minus declines positive and a down mark after three consecutive negative sessions. The same rule is described as producing whip-saws while remaining aligned once a trend is underway.
All readings on this track · 57 readings
- 1988Constructing moving averages: weights, smoothing and crossovers
- 1988Constructing breadth and average trend states
- 1989Evaluating an always-in-the-market moving-average crossover
- 1989Constructing symmetric market-breadth ratio accumulators
- 1989Objective crossover tests of Fibonacci wave ratios
- 1990Volume-adjusted moving average construction
- 1991Constructing a mechanical crossover on a synthetic price series
- 1991A two-speed breadth reading for intermediate market direction
- 1992A Deutschemark yield map with dual-average and relative-strength timing
- 1992Confirming currency-fund trends with a crossover and a filter
- 1992A moving-average slope filter for crossover signals
- 1992Occupancy and split-sample tests for average crossovers
- 1994Gold-mining seasonality and bond-fund duration switching
- 1994Price oscillator from two moving averages
- 1995Explicit exponential weights and binary entry filters
- 1996Currency futures crossover with slope, bond filter, and stop
- 1996Two-market average crossover entry with a fixed stop
- 1997Construction of a filtered three-average crossover
- 1998Two-group exponential average compression as a trend filter
- 1998Constructing r-squared trend filters with dual lookbacks
- 1998Moving-average length is a habit, not a secret
- 1999Solving the close that triggers a moving-average crossover
- 2000Kagi yang and yin control versus crossover noise
- 2000Constructing simple moving average crossover filters
- 2000Building a vertical-horizontal filter to gate trend signals
- 2000Two-average crossover as a check on trend following
- 2003Stacked exponential-average retracement entries and extreme stops
- 2003Evaluating oscillator thresholds against optimized crossovers
- 2004Constructing a semicycle trend-quality filter
- 2004Commodity subgroups labeled by crossover, support, or convergence
- 2004Full-window evaluation of crossover trend systems
- 2004Two-average trend filters as a classroom critique of indicator stacking
- 2005Three-layer confirmation from a moving-average cross, candles, and Q-stick
- 2005Charting put prices beside an equity breakdown
- 2005Range-gated moving-average crossover construction
- 2007Anticipating a simple-average crossover with a threshold-close
- 2007Anticipating moving-average crossovers one bar ahead
- 2007Lead-series moving-average crossovers with a stochastic and relative strength index
- 2007Next-bar SMA crossover hypotheses from theoretical crossing values
- 2007Anticipating a moving-average crossover before confirmation
- 2007A three-horizon moving-average stack as a construction problem
- 2007Confirming trend with regression slope and r-squared
- 2008Constructing a multi-timeframe smoothed crossover
- 2008Best-day clusters versus trend filters
- 2008Allied markets as a confirmation gate for crossover and breakout signals
- 2008Weekly exponential-average crossover as a mechanical trend case study
- 2010Evaluating a 200-day crossover as long, short, and stand-aside rules
- 2010Read a 10-and-40 trend on two neighboring time frames
- 2012Sampling unit as a first-class parameter on dual simple moving averages
- 2012Constructing index-ETF entries from volatility-index persistence
- 2013Moving-average baselines versus crossover signals
- 2013Constructing a typical-price and heikin-ashi crossover as one mechanical procedure
- 2016A three-gate checklist for longs after a sharp drop
- 2016Weekly inflation-ratio crossover for commodity regimes
- 2017Normalized Laguerre zero-axis warning as a two-marker construction
- 2019Range-weighted construction of an adaptive exponential moving average
- 2020Construct a second-pullback entry after a moving-average crossover