2000issue C061-5
Constructing simple moving average crossover filters
A simple moving average is an unweighted mean of a fixed window of ordered price observations that advances one sampling interval at a time. A centered-plot cannot be known until half the lookback has elapsed, so a noncentered-plot is used to treat a price crossing as a contemporaneous trend-reversal hypothesis.
- A simple moving average advances a fixed window by dropping the oldest observation and adding the newest.
- A centered-plot describes the completed window only after half the lookback has elapsed, so a noncentered-plot is what makes a moving-average-crossover readable in real time.
- Shorter lookback-spans produce earlier crossings and more whipsaws; longer spans produce fewer, later crossings.
- A crossing is treated as more credible when the average has acted as dynamic-support-resistance, when the line is relatively flat, and when trendline-confirmation is present. Repeated whipsaws replace crossovers with a range-boundary-filter.
Building the simple moving average
A simple moving average is constructed by averaging a fixed window of successive observations, then advancing that window by dropping the oldest observation and adding the newest. In this construction the simple moving average is an unweighted mean, and the lookback-span is the number of sampling intervals inside the window.
Centered-plot and noncentered-plot
A mathematically centered average belongs at the midpoint of its lookback and therefore cannot be known in real time until half of that lookback has elapsed. That centered-plot describes the completed window only after the delay.
Because of that delay, the same average is given a noncentered-plot at the latest observation. A price move through that line is treated as a trend-reversal hypothesis. The hypothesized trend change marked when price moves through the noncentered average is a moving-average-crossover.
Lookback-span by trend horizon
Shorter lookbacks produce earlier crossings near turning points and more false crossings in ranges. Longer lookbacks produce fewer, later crossings. A whipsaw is a crossing that reverses before a usable trend develops, and it is typical of a short lookback inside a range.
Lookbacks are grouped by trend horizon rather than fitted to a single market: multi-month spans for primary trends, multi-week spans for intermediate trends, and multi-day spans for short-term trends, always as a compromise between timeliness and sensitivity.
Reading a crossing as a filter
A crossing is treated as more credible when the average has repeatedly turned price without being pierced, functioning as a moving support or resistance zone. That repeated failure of price to pierce a still-valid average is dynamic-support-resistance, and the line is treated as a moving barrier until a decisive break.
Crossings of a relatively flat average are treated as more reliable than crossings of a steeply rising or falling average, because a steep average implies strong residual momentum.
Trendline-confirmation and the range-boundary-filter
A moving-average crossing that coincides with a trendline break supplies independent structural evidence that the same reversal is underway. That independently drawn price structure is trendline-confirmation.
Once repeated whipsaws mark a trading range, the average no longer acts as support or resistance. Range-boundary-filter lines then replace crossovers as the next-trend filter.
Short versus long simple moving averages through 1999
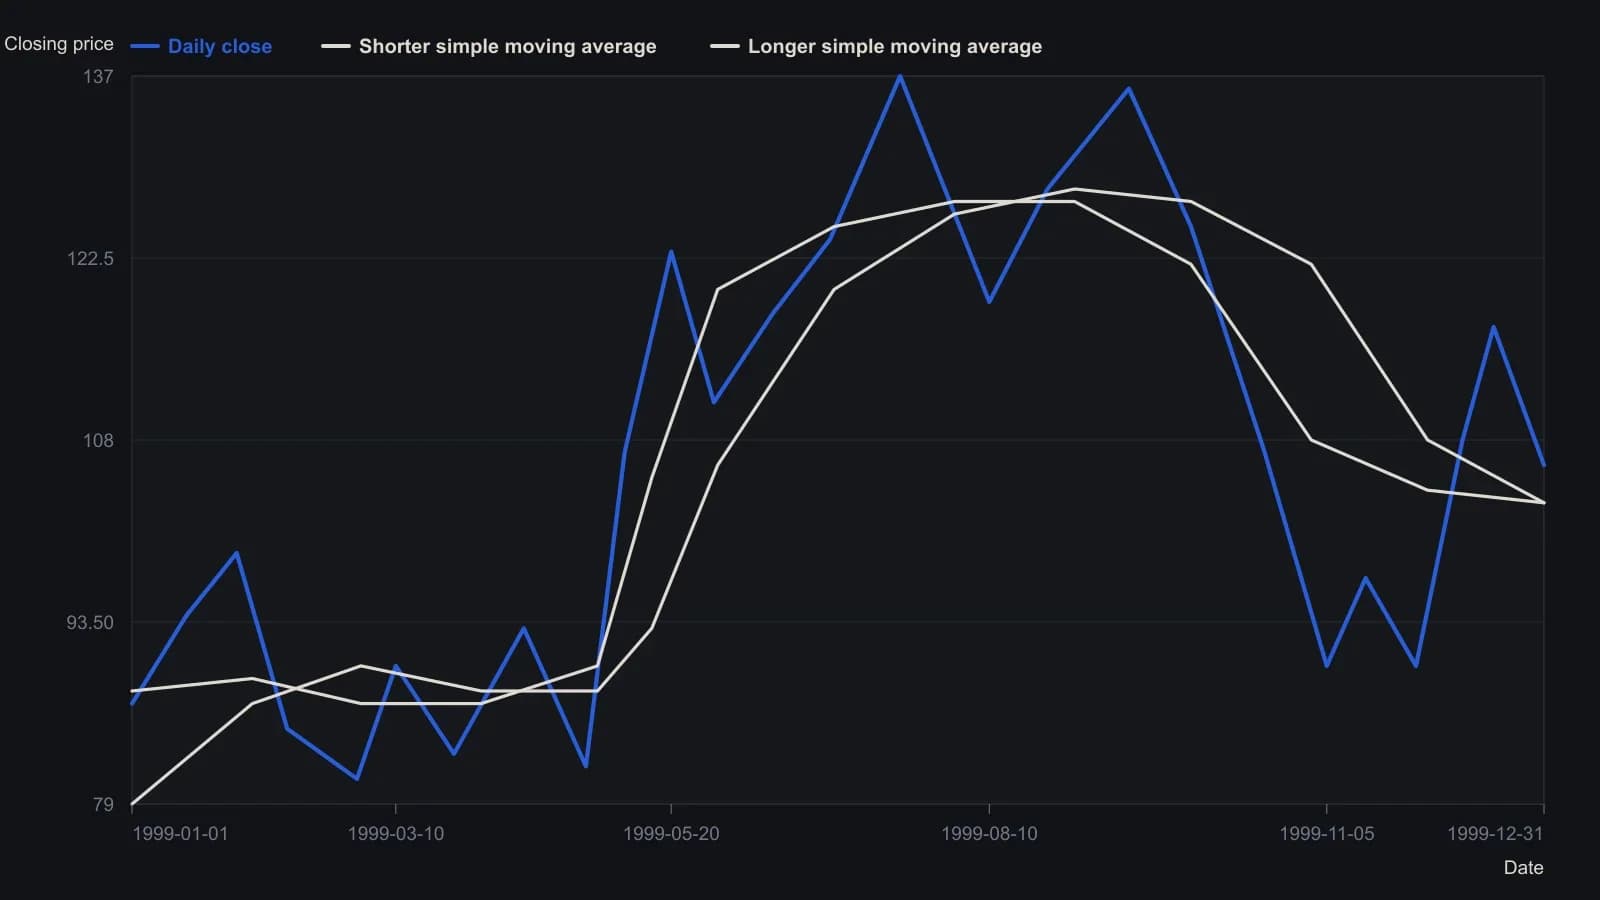
Lookback lengths are not stated on this figure. Readings are approximate from the raster and rounded to the nearest point.
All readings on this track · 57 readings
- 1988Constructing moving averages: weights, smoothing and crossovers
- 1988Constructing breadth and average trend states
- 1989Evaluating an always-in-the-market moving-average crossover
- 1989Constructing symmetric market-breadth ratio accumulators
- 1989Objective crossover tests of Fibonacci wave ratios
- 1990Volume-adjusted moving average construction
- 1991Constructing a mechanical crossover on a synthetic price series
- 1991A two-speed breadth reading for intermediate market direction
- 1992A Deutschemark yield map with dual-average and relative-strength timing
- 1992Confirming currency-fund trends with a crossover and a filter
- 1992A moving-average slope filter for crossover signals
- 1992Occupancy and split-sample tests for average crossovers
- 1994Gold-mining seasonality and bond-fund duration switching
- 1994Price oscillator from two moving averages
- 1995Explicit exponential weights and binary entry filters
- 1996Currency futures crossover with slope, bond filter, and stop
- 1996Two-market average crossover entry with a fixed stop
- 1997Construction of a filtered three-average crossover
- 1998Two-group exponential average compression as a trend filter
- 1998Constructing r-squared trend filters with dual lookbacks
- 1998Moving-average length is a habit, not a secret
- 1999Solving the close that triggers a moving-average crossover
- 2000Kagi yang and yin control versus crossover noise
- 2000Constructing simple moving average crossover filters
- 2000Building a vertical-horizontal filter to gate trend signals
- 2000Two-average crossover as a check on trend following
- 2003Stacked exponential-average retracement entries and extreme stops
- 2003Evaluating oscillator thresholds against optimized crossovers
- 2004Constructing a semicycle trend-quality filter
- 2004Commodity subgroups labeled by crossover, support, or convergence
- 2004Full-window evaluation of crossover trend systems
- 2004Two-average trend filters as a classroom critique of indicator stacking
- 2005Three-layer confirmation from a moving-average cross, candles, and Q-stick
- 2005Charting put prices beside an equity breakdown
- 2005Range-gated moving-average crossover construction
- 2007Anticipating a simple-average crossover with a threshold-close
- 2007Anticipating moving-average crossovers one bar ahead
- 2007Lead-series moving-average crossovers with a stochastic and relative strength index
- 2007Next-bar SMA crossover hypotheses from theoretical crossing values
- 2007Anticipating a moving-average crossover before confirmation
- 2007A three-horizon moving-average stack as a construction problem
- 2007Confirming trend with regression slope and r-squared
- 2008Constructing a multi-timeframe smoothed crossover
- 2008Best-day clusters versus trend filters
- 2008Allied markets as a confirmation gate for crossover and breakout signals
- 2008Weekly exponential-average crossover as a mechanical trend case study
- 2010Evaluating a 200-day crossover as long, short, and stand-aside rules
- 2010Read a 10-and-40 trend on two neighboring time frames
- 2012Sampling unit as a first-class parameter on dual simple moving averages
- 2012Constructing index-ETF entries from volatility-index persistence
- 2013Moving-average baselines versus crossover signals
- 2013Constructing a typical-price and heikin-ashi crossover as one mechanical procedure
- 2016A three-gate checklist for longs after a sharp drop
- 2016Weekly inflation-ratio crossover for commodity regimes
- 2017Normalized Laguerre zero-axis warning as a two-marker construction
- 2019Range-weighted construction of an adaptive exponential moving average
- 2020Construct a second-pullback entry after a moving-average crossover