1992issue C081-5
A moving-average slope filter for crossover signals
A moving-average-crossover is a reversal signal that goes long when price crosses above a chosen average and short when price crosses below it. A separate slope-measure of recent average values can serve as a trend-filter, permitting that same crossover when the average is steep and blocking it when the average is flat.
- Keep the moving-average-crossover as the reversal signal and add a trend-filter so a slope-measure can permit or block that signal.
- A short stretch of a moving average can be treated as nearly linear, so the standard deviation of those recent average values is small when the slope is shallow and large when the slope is steep.
- Moving-average length sets how quickly the slope filter cycles. Lookback length sets how smooth the filter is.
- Relative to an ungated crossover, the slope gate delayed some entries and was designed to skip signals that would have fired during congestion.
Two separate jobs
A moving-average is a smoothed series of ordered prices that reduces day-to-day noise so direction can be read as price standing above or below the average. A moving-average-crossover is a reversal signal that goes long when price crosses above a chosen average and goes short when price crosses below it.
A trend-filter is a second quantitative condition that permits or blocks the crossover so entries are more likely when the average is sloping with authority and less likely when it is flat. The archive keeps those jobs distinct rather than folding them into a single extra line.
A slope-measure from recent average values
A short stretch of a moving average can be treated as nearly linear, so the standard deviation of those recent average values is small when the slope is shallow and large when the slope is steep. That spread is the slope-measure, a stand-in for how steep the stretch is.
A trend filter can be defined as the standard deviation of the last x readings of a y-period moving average, rising when price is trending with more authority and falling when price is range-bound.
Lookback is the number of recent average readings used to compute the slope-measure. A longer lookback makes the filter smoother, while the average length itself sets how quickly the filter cycles.
An illustrated construction
One illustrated construction used an eight-bar standard deviation of a 21-bar simple moving average of closing prices. The same pair can be built in a spreadsheet from dates, closes, the 21-day average, and the eight-value standard deviation.
Changing the moving-average length changes how quickly that slope filter cycles. Changing the lookback used for the standard deviation changes how smooth the filter is.
S&P 500 trend analysis indicator, May–November 1989
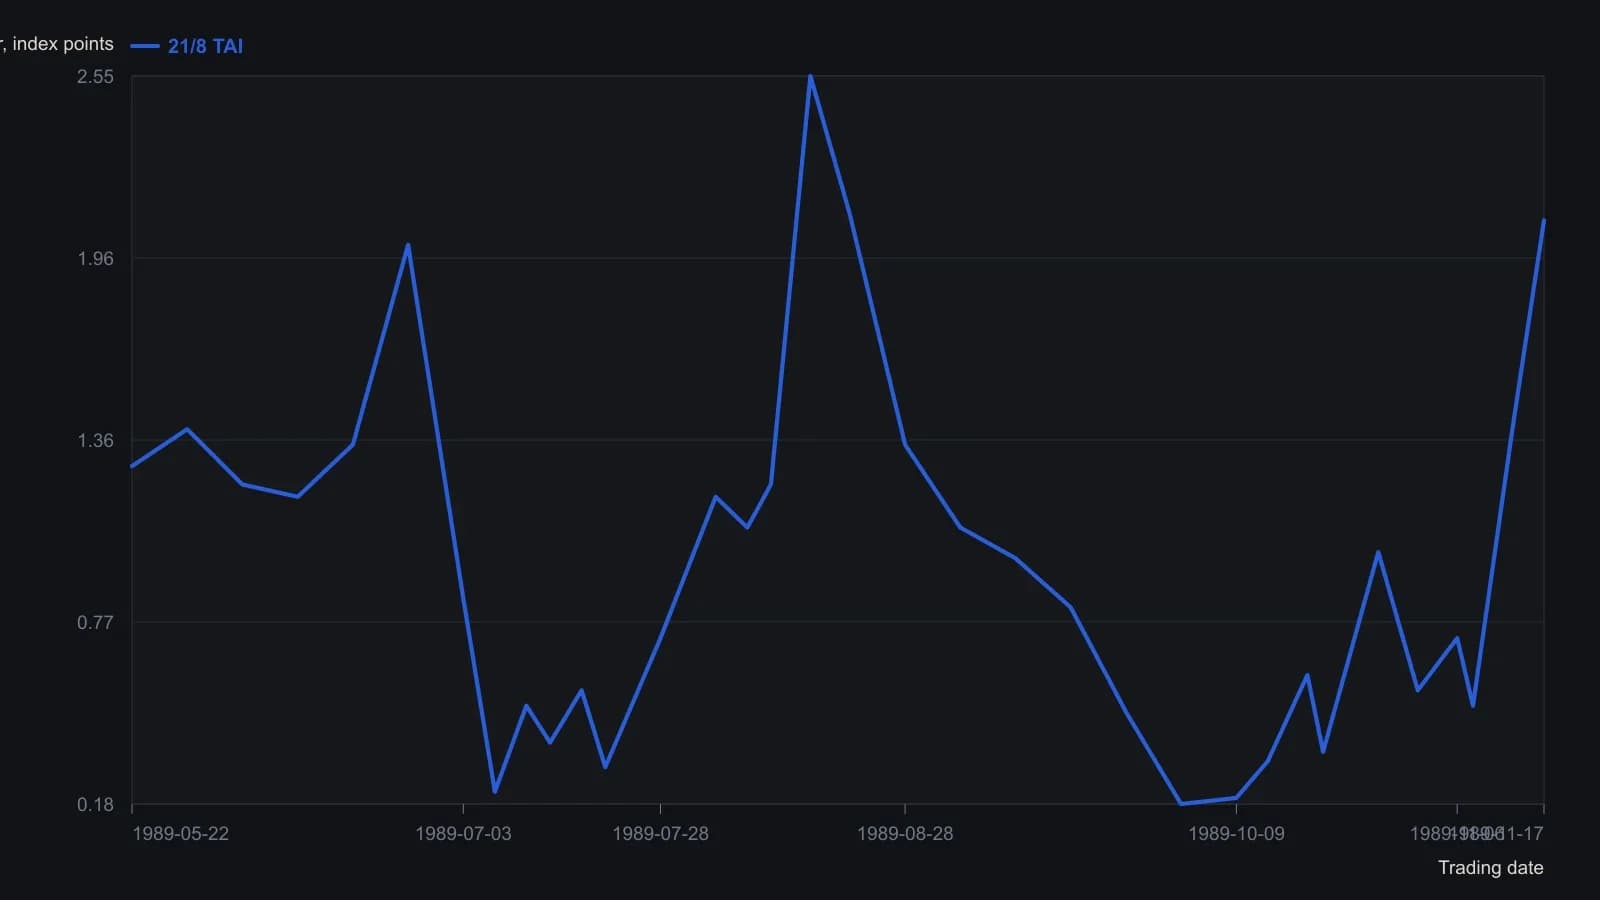
Source fixes TAI at a 21-bar simple moving average with an 8-bar lookback (MetaStock: std(mov(c,21,s),8)). Digitized by eye from the raster; treat readings as roughly ±0.1 index point.
The unfiltered crossover
The unfiltered comparison rule bought when closing price crossed above a 26-bar moving average and sold when it crossed below. The rule was applied to 1,440 daily bars of a broad equity index, omitting commission and interest for clarity.
The gated crossover
The gated rule allowed that same 26-bar crossover only when a four-bar lookback of a 38-bar moving average stood above a ten-bar lookback of the same 38-bar average.
The intended reading is that a steeper recent slope than a longer slope window marks a market beginning to move with more authority, a condition more likely after a mature trendless stretch.
Relative to the ungated 26-bar crossover, the slope gate delayed some entries and was designed to skip signals that would have fired during congestion.
Editorial reading
TradersWeek editorial: treat the crossover as a directional hypothesis and the slope of an average as a separate permission switch. Keep the baseline rule intact, add one explicit trend-quality gate, and judge the combination by when trades are allowed rather than by how clever the extra line looks.
All readings on this track · 57 readings
- 1988Constructing moving averages: weights, smoothing and crossovers
- 1988Constructing breadth and average trend states
- 1989Evaluating an always-in-the-market moving-average crossover
- 1989Constructing symmetric market-breadth ratio accumulators
- 1989Objective crossover tests of Fibonacci wave ratios
- 1990Volume-adjusted moving average construction
- 1991Constructing a mechanical crossover on a synthetic price series
- 1991A two-speed breadth reading for intermediate market direction
- 1992A Deutschemark yield map with dual-average and relative-strength timing
- 1992Confirming currency-fund trends with a crossover and a filter
- 1992A moving-average slope filter for crossover signals
- 1992Occupancy and split-sample tests for average crossovers
- 1994Gold-mining seasonality and bond-fund duration switching
- 1994Price oscillator from two moving averages
- 1995Explicit exponential weights and binary entry filters
- 1996Currency futures crossover with slope, bond filter, and stop
- 1996Two-market average crossover entry with a fixed stop
- 1997Construction of a filtered three-average crossover
- 1998Two-group exponential average compression as a trend filter
- 1998Constructing r-squared trend filters with dual lookbacks
- 1998Moving-average length is a habit, not a secret
- 1999Solving the close that triggers a moving-average crossover
- 2000Kagi yang and yin control versus crossover noise
- 2000Constructing simple moving average crossover filters
- 2000Building a vertical-horizontal filter to gate trend signals
- 2000Two-average crossover as a check on trend following
- 2003Stacked exponential-average retracement entries and extreme stops
- 2003Evaluating oscillator thresholds against optimized crossovers
- 2004Constructing a semicycle trend-quality filter
- 2004Commodity subgroups labeled by crossover, support, or convergence
- 2004Full-window evaluation of crossover trend systems
- 2004Two-average trend filters as a classroom critique of indicator stacking
- 2005Three-layer confirmation from a moving-average cross, candles, and Q-stick
- 2005Charting put prices beside an equity breakdown
- 2005Range-gated moving-average crossover construction
- 2007Anticipating a simple-average crossover with a threshold-close
- 2007Anticipating moving-average crossovers one bar ahead
- 2007Lead-series moving-average crossovers with a stochastic and relative strength index
- 2007Next-bar SMA crossover hypotheses from theoretical crossing values
- 2007Anticipating a moving-average crossover before confirmation
- 2007A three-horizon moving-average stack as a construction problem
- 2007Confirming trend with regression slope and r-squared
- 2008Constructing a multi-timeframe smoothed crossover
- 2008Best-day clusters versus trend filters
- 2008Allied markets as a confirmation gate for crossover and breakout signals
- 2008Weekly exponential-average crossover as a mechanical trend case study
- 2010Evaluating a 200-day crossover as long, short, and stand-aside rules
- 2010Read a 10-and-40 trend on two neighboring time frames
- 2012Sampling unit as a first-class parameter on dual simple moving averages
- 2012Constructing index-ETF entries from volatility-index persistence
- 2013Moving-average baselines versus crossover signals
- 2013Constructing a typical-price and heikin-ashi crossover as one mechanical procedure
- 2016A three-gate checklist for longs after a sharp drop
- 2016Weekly inflation-ratio crossover for commodity regimes
- 2017Normalized Laguerre zero-axis warning as a two-marker construction
- 2019Range-weighted construction of an adaptive exponential moving average
- 2020Construct a second-pullback entry after a moving-average crossover