2017issue C0824-28
Normalized Laguerre zero-axis warning as a two-marker construction
The construction maps a Laguerre filter onto a static zero axis and plots signed residual columns so a fading peak can receive an early warning dot and a later close through the line can receive a crossover dot. TradersWeek editorial reading: treat the first marker as a watch cue only, and keep the moving-average crossover as the sole confirmation that the trend filter has been crossed.
- Substitute a short-alpha Laguerre filter for a short-term moving average, then redraw that value as a static zero axis so each column is the signed distance from the latest close to the filter.
- Draw an early warning dot only after same-sign columns shrink from a peak, including after gap-driven moves, and treat that marker as a possible later turn rather than a completed trade signal.
- Add a crossover dot only after the close has moved through the normalized Laguerre line, because small columns near zero make a color change an unreliable visual of the moving-average crossover.
- Read column height as distance from the updating filter, not as the raw price path, so a strong-trend touch of the line as support or resistance is not a crossover warning.
A dip under a shorter average, then a tighter smoother
The construction pairs a long-uptrend dip below a shorter moving average with an adaptive Laguerre smoother intended to sharpen the later entry and exit marks. The pairing is framed with an elasticity analogy in which small displacements scale with the applied load.
The warning overlay substitutes a short-alpha Laguerre filter, an adaptive smoother from digital signal processing, for a short-term moving average. It is described as tracking price more tightly while keeping similar reactivity.
Read the swing from a residual, not a slope
Construction maps that Laguerre value onto a static zero axis, the normalized zero axis, and plots each column as the signed distance between the latest close and the normalized filter. Those divergence columns let the beginning, middle, and end of a swing be read from the residual rather than from a sloping average.
A short-length filter is passed through a longer-length filter of the same type. That passband pairing, with the current close fed through the pair, is presented as removing delay so the green or red residual is a contemporaneous measure of price-versus-filter divergence.
Bank of America residual on a static Laguerre zero axis
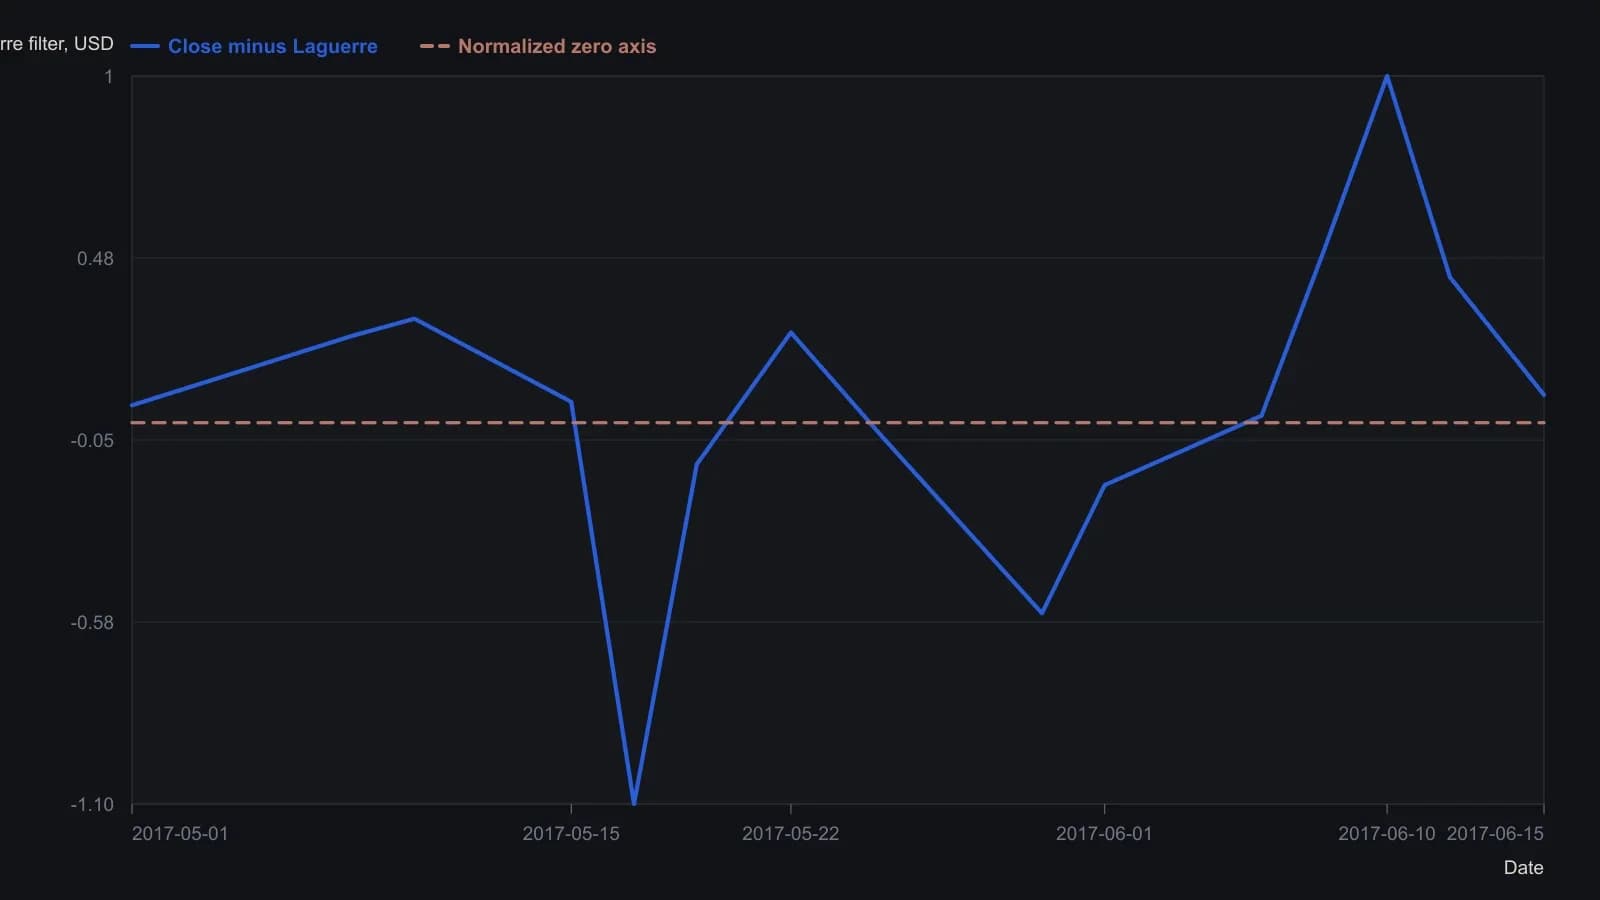
Digitized from the printed EWS pane; the raster supports about 0.05 resolution, not the three-decimal labels. The figure does not print a year; May–June 2017 matches the August 2017 issue date and the $22–24 BAC prints.
Place an early warning only after columns fade
Early warning dots are drawn only after same-sign columns shrink from a peak, including gap-driven moves. The marker sits on the largest column, which requires at least one bar of delay. A later larger column resets the setpoint until magnitudes decline again.
The count of columns between the first and second warning dots is treated as a timing analog for the remaining lead before a later direction change. A four-bar gap is illustrated as implying a four-bar lead. Columns crowding the zero line reduce the chance of further dots.
Add a later mark after the close crosses
Crossover dots mark a close moving through the normalized Laguerre line. They are added because small columns and consolidation at the zero axis make a color change an unreliable visual of the moving-average crossover.
The overlay is distinguished from range oscillators in that it does not forecast the next price. It only warns that a reverse may occur within the next few bars, using an early warning dot that arrives before a tradeable turn and a later crossover dot that appears after the crossing to bound a watch window.
All readings on this track · 57 readings
- 1988Constructing moving averages: weights, smoothing and crossovers
- 1988Constructing breadth and average trend states
- 1989Evaluating an always-in-the-market moving-average crossover
- 1989Constructing symmetric market-breadth ratio accumulators
- 1989Objective crossover tests of Fibonacci wave ratios
- 1990Volume-adjusted moving average construction
- 1991Constructing a mechanical crossover on a synthetic price series
- 1991A two-speed breadth reading for intermediate market direction
- 1992A Deutschemark yield map with dual-average and relative-strength timing
- 1992Confirming currency-fund trends with a crossover and a filter
- 1992A moving-average slope filter for crossover signals
- 1992Occupancy and split-sample tests for average crossovers
- 1994Gold-mining seasonality and bond-fund duration switching
- 1994Price oscillator from two moving averages
- 1995Explicit exponential weights and binary entry filters
- 1996Currency futures crossover with slope, bond filter, and stop
- 1996Two-market average crossover entry with a fixed stop
- 1997Construction of a filtered three-average crossover
- 1998Two-group exponential average compression as a trend filter
- 1998Constructing r-squared trend filters with dual lookbacks
- 1998Moving-average length is a habit, not a secret
- 1999Solving the close that triggers a moving-average crossover
- 2000Kagi yang and yin control versus crossover noise
- 2000Constructing simple moving average crossover filters
- 2000Building a vertical-horizontal filter to gate trend signals
- 2000Two-average crossover as a check on trend following
- 2003Stacked exponential-average retracement entries and extreme stops
- 2003Evaluating oscillator thresholds against optimized crossovers
- 2004Constructing a semicycle trend-quality filter
- 2004Commodity subgroups labeled by crossover, support, or convergence
- 2004Full-window evaluation of crossover trend systems
- 2004Two-average trend filters as a classroom critique of indicator stacking
- 2005Three-layer confirmation from a moving-average cross, candles, and Q-stick
- 2005Charting put prices beside an equity breakdown
- 2005Range-gated moving-average crossover construction
- 2007Anticipating a simple-average crossover with a threshold-close
- 2007Anticipating moving-average crossovers one bar ahead
- 2007Lead-series moving-average crossovers with a stochastic and relative strength index
- 2007Next-bar SMA crossover hypotheses from theoretical crossing values
- 2007Anticipating a moving-average crossover before confirmation
- 2007A three-horizon moving-average stack as a construction problem
- 2007Confirming trend with regression slope and r-squared
- 2008Constructing a multi-timeframe smoothed crossover
- 2008Best-day clusters versus trend filters
- 2008Allied markets as a confirmation gate for crossover and breakout signals
- 2008Weekly exponential-average crossover as a mechanical trend case study
- 2010Evaluating a 200-day crossover as long, short, and stand-aside rules
- 2010Read a 10-and-40 trend on two neighboring time frames
- 2012Sampling unit as a first-class parameter on dual simple moving averages
- 2012Constructing index-ETF entries from volatility-index persistence
- 2013Moving-average baselines versus crossover signals
- 2013Constructing a typical-price and heikin-ashi crossover as one mechanical procedure
- 2016A three-gate checklist for longs after a sharp drop
- 2016Weekly inflation-ratio crossover for commodity regimes
- 2017Normalized Laguerre zero-axis warning as a two-marker construction
- 2019Range-weighted construction of an adaptive exponential moving average
- 2020Construct a second-pullback entry after a moving-average crossover