2000issue C091-2
Two-average crossover as a check on trend following
A reconstructed trend-following rule and a 20-versus-50 exponential moving-average-crossover were run on 13 large-capitalization stocks from the same start date. Editorial reading treats that simpler crossover as the public rival extra structure still has to face.
- The reconstructed trend-following rule entered long only after the close had stayed above an instantaneous-trendline for more than half the dominant-cycle, and exited when the close fell below that line.
- The control was a moving-average-crossover: buy when a 20-day exponential moving average crosses a 50-day exponential moving average, and sell when the close drops below the 50-day average.
- Both rules used the same 13 large-capitalization stocks from 7 August 1998. The reconstructed test generated 85 trades and the two-average crossover generated 54 trades.
- Editorial guidance treats published techniques as tools the reader must test on their own instruments and window, and says a tool that fails that test should not be used.
A reconstructed trend-following rule
A published adaptive trend-following procedure was reconstructed as one entry and exit sequence. A long was taken only after the close had remained above an instantaneous-trendline for more than half the dominant-cycle. The long was closed when the close fell below that trendline.
In this reconstruction, trend-following is a single procedure that stays with direction after a defined persistence test of price versus the trendline. The instantaneous-trendline is the adaptive line the close must hold on the trend side of before a long is accepted. The dominant-cycle is the estimated oscillation length that sets how long that hold must last.
The two-average control
The comparison rule was a moving-average-crossover. It bought when a 20-day exponential moving average crossed a 50-day exponential moving average. It sold when the close dropped below the 50-day average.
Each moving-average is a lookback smoother of closes. Here those smoothers supply both crossover legs and a baseline trend reference. The crossover is the explicit control against the more elaborate trend procedure.
One shared-evaluation-tape
Both rules were run on the same 13 large-capitalization stocks with a shared start date of 7 August 1998. A shared-evaluation-tape is one fixed name list and start date, used so two trend procedures can be compared without changing the sample.
On that shared sample the reconstructed trend-following test generated 85 trades and the two-average crossover generated 54 trades. The evaluation used the simple moving-average-crossover as the baseline procedure against which the more elaborate construction was judged.
Average profit: Ehlers trend rule vs 20/50 EMA crossover
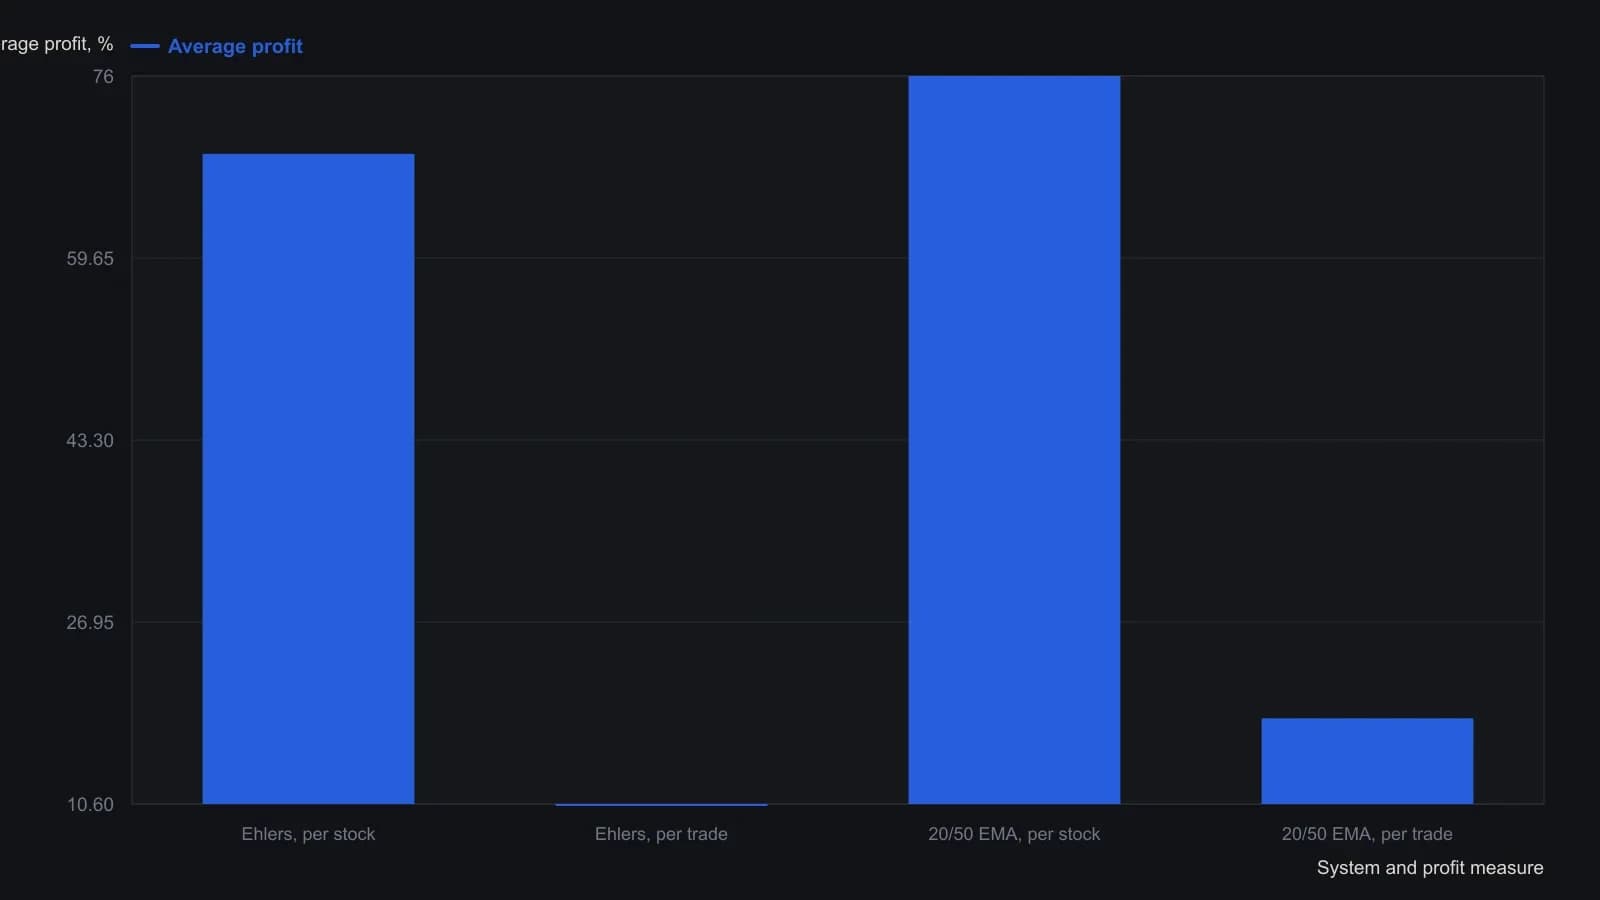
Cook chose 13 large-capitalization stocks from 7 August 1998 and noted that big movers such as QCOM lifted the Ehlers averages. The Ehlers rule bought when the close stayed above the instantaneous trendline longer than half the dominant cycle and sold when the close fell below it. The control bought on a 20-day EMA cross of the 50-day EMA and sold when the close dropped below the 50-day EMA.
All readings on this track · 57 readings
- 1988Constructing moving averages: weights, smoothing and crossovers
- 1988Constructing breadth and average trend states
- 1989Evaluating an always-in-the-market moving-average crossover
- 1989Constructing symmetric market-breadth ratio accumulators
- 1989Objective crossover tests of Fibonacci wave ratios
- 1990Volume-adjusted moving average construction
- 1991Constructing a mechanical crossover on a synthetic price series
- 1991A two-speed breadth reading for intermediate market direction
- 1992A Deutschemark yield map with dual-average and relative-strength timing
- 1992Confirming currency-fund trends with a crossover and a filter
- 1992A moving-average slope filter for crossover signals
- 1992Occupancy and split-sample tests for average crossovers
- 1994Gold-mining seasonality and bond-fund duration switching
- 1994Price oscillator from two moving averages
- 1995Explicit exponential weights and binary entry filters
- 1996Currency futures crossover with slope, bond filter, and stop
- 1996Two-market average crossover entry with a fixed stop
- 1997Construction of a filtered three-average crossover
- 1998Two-group exponential average compression as a trend filter
- 1998Constructing r-squared trend filters with dual lookbacks
- 1998Moving-average length is a habit, not a secret
- 1999Solving the close that triggers a moving-average crossover
- 2000Kagi yang and yin control versus crossover noise
- 2000Constructing simple moving average crossover filters
- 2000Building a vertical-horizontal filter to gate trend signals
- 2000Two-average crossover as a check on trend following
- 2003Stacked exponential-average retracement entries and extreme stops
- 2003Evaluating oscillator thresholds against optimized crossovers
- 2004Constructing a semicycle trend-quality filter
- 2004Commodity subgroups labeled by crossover, support, or convergence
- 2004Full-window evaluation of crossover trend systems
- 2004Two-average trend filters as a classroom critique of indicator stacking
- 2005Three-layer confirmation from a moving-average cross, candles, and Q-stick
- 2005Charting put prices beside an equity breakdown
- 2005Range-gated moving-average crossover construction
- 2007Anticipating a simple-average crossover with a threshold-close
- 2007Anticipating moving-average crossovers one bar ahead
- 2007Lead-series moving-average crossovers with a stochastic and relative strength index
- 2007Next-bar SMA crossover hypotheses from theoretical crossing values
- 2007Anticipating a moving-average crossover before confirmation
- 2007A three-horizon moving-average stack as a construction problem
- 2007Confirming trend with regression slope and r-squared
- 2008Constructing a multi-timeframe smoothed crossover
- 2008Best-day clusters versus trend filters
- 2008Allied markets as a confirmation gate for crossover and breakout signals
- 2008Weekly exponential-average crossover as a mechanical trend case study
- 2010Evaluating a 200-day crossover as long, short, and stand-aside rules
- 2010Read a 10-and-40 trend on two neighboring time frames
- 2012Sampling unit as a first-class parameter on dual simple moving averages
- 2012Constructing index-ETF entries from volatility-index persistence
- 2013Moving-average baselines versus crossover signals
- 2013Constructing a typical-price and heikin-ashi crossover as one mechanical procedure
- 2016A three-gate checklist for longs after a sharp drop
- 2016Weekly inflation-ratio crossover for commodity regimes
- 2017Normalized Laguerre zero-axis warning as a two-marker construction
- 2019Range-weighted construction of an adaptive exponential moving average
- 2020Construct a second-pullback entry after a moving-average crossover