2004issue C111-4
Two-average trend filters as a classroom critique of indicator stacking
A daily trend filter from two moving averages is enough to write a gated crossover and see the same marks change character when price chops. Editorial reading: run that inspection before anyone adds another oscillator.
- A daily-chart trend filter can be assembled from a five-period exponential average and a 20-period simple average, then gated by whether price sits below or above both lines.
- The long moving-average-crossover rule is the shorter volatility-index average crossing under the longer average while price remains below both lines. The short rule is the shorter average crossing over the longer average while price remains above both lines.
- Nearby lookback pairs such as 9 and 18, 10 and 20, or 15 and 30 periods were treated as interchangeable. Hunting a single best pair is a form of curve-fitting.
- The same volatility-index filter produced a comparable sequence of marks on a second equity-index daily series, and a 9-period versus 27-period exponential crossover changed character when price chopped rather than trended.
The remaining toolkit after the stack
After a long stack of breadth, volume, oscillator, band, and pivot studies was discarded, the remaining toolkit was one chart time frame plus a couple of basic moving-average measures used to buy already-strong charts and sell already-weak ones.
In that remaining kit, a moving average is a lookback smoother of ordered prices used as a quantitative baseline rather than a forecast of exact turning points. A trend filter is a quantitative side-of-market gate meant to keep participation aligned with a measured trend instead of calling tops and bottoms.
Write the crossover and the price-location gate
A daily-chart trend filter can be assembled from two moving averages: a five-period exponential average and a 20-period simple average.
A moving-average crossover is a repeatable chart signal that fires when a shorter average crosses a longer average, often gated by where price sits relative to both lines. The price-location gate is the extra condition that price must sit below both averages for a long mark or above both for a short mark.
The long moving-average-crossover rule is the shorter volatility-index average crossing under the longer average while price remains below both lines. The short moving-average-crossover rule is the shorter volatility-index average crossing over the longer average while price remains above both lines.
How the same marks look in a range and in a trend
One February to June 2004 daily example marked five such entries while a broad equity index stayed inside a rolling range near 1080 to 1160.
The same volatility-index moving-average trend filter, applied to a second equity-index daily series, produced a comparable sequence of long and short marks.
A 9-period versus 27-period exponential moving-average crossover was plotted on both a trending stretch and a sideways range to show that the identical signal set changes character when price chops.
Nearby lookbacks and curve-fitting
Nearby lookback pairs such as 9 and 18, 10 and 20, or 15 and 30 periods were treated as interchangeable enough that hunting a single best pair is a form of curve-fitting. Curve-fitting, in this usage, is choosing one supposedly optimal average pair on a single historical window instead of treating nearby lookbacks as interchangeable.
S&P 500 daily, February–June 2004
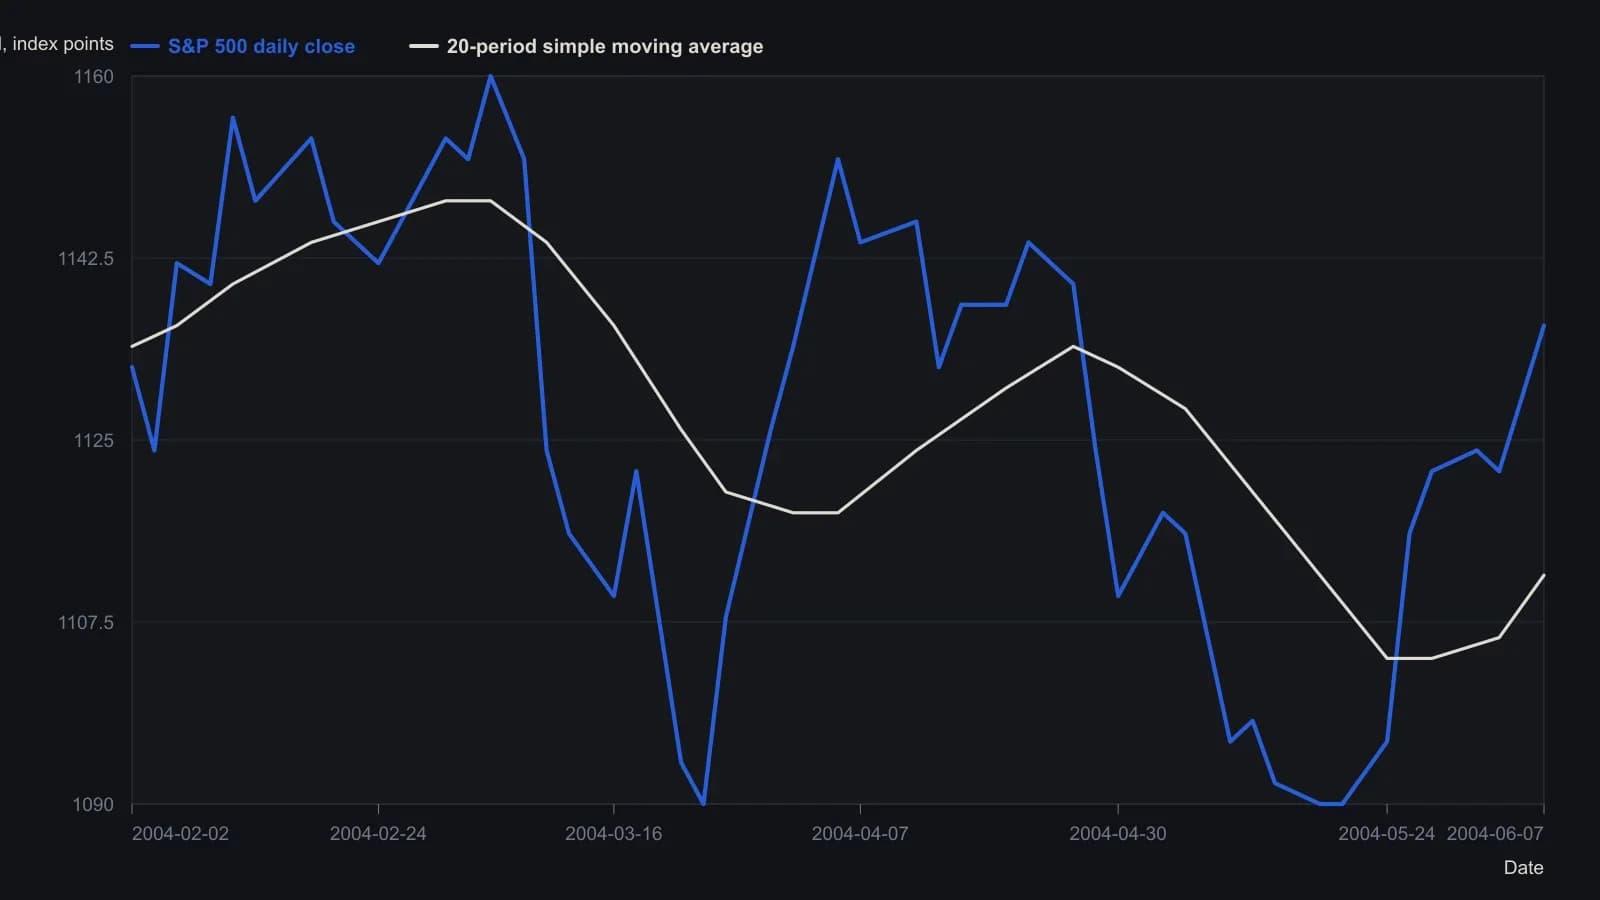
Closes are approximate visual readings from the candlestick pane. The source states highs near 1160 and lows around 1080 and last print 1136.47; moving-average lengths are the article’s 5-period EMA and 20-period SMA.
All readings on this track · 57 readings
- 1988Constructing moving averages: weights, smoothing and crossovers
- 1988Constructing breadth and average trend states
- 1989Evaluating an always-in-the-market moving-average crossover
- 1989Constructing symmetric market-breadth ratio accumulators
- 1989Objective crossover tests of Fibonacci wave ratios
- 1990Volume-adjusted moving average construction
- 1991Constructing a mechanical crossover on a synthetic price series
- 1991A two-speed breadth reading for intermediate market direction
- 1992A Deutschemark yield map with dual-average and relative-strength timing
- 1992Confirming currency-fund trends with a crossover and a filter
- 1992A moving-average slope filter for crossover signals
- 1992Occupancy and split-sample tests for average crossovers
- 1994Gold-mining seasonality and bond-fund duration switching
- 1994Price oscillator from two moving averages
- 1995Explicit exponential weights and binary entry filters
- 1996Currency futures crossover with slope, bond filter, and stop
- 1996Two-market average crossover entry with a fixed stop
- 1997Construction of a filtered three-average crossover
- 1998Two-group exponential average compression as a trend filter
- 1998Constructing r-squared trend filters with dual lookbacks
- 1998Moving-average length is a habit, not a secret
- 1999Solving the close that triggers a moving-average crossover
- 2000Kagi yang and yin control versus crossover noise
- 2000Constructing simple moving average crossover filters
- 2000Building a vertical-horizontal filter to gate trend signals
- 2000Two-average crossover as a check on trend following
- 2003Stacked exponential-average retracement entries and extreme stops
- 2003Evaluating oscillator thresholds against optimized crossovers
- 2004Constructing a semicycle trend-quality filter
- 2004Commodity subgroups labeled by crossover, support, or convergence
- 2004Full-window evaluation of crossover trend systems
- 2004Two-average trend filters as a classroom critique of indicator stacking
- 2005Three-layer confirmation from a moving-average cross, candles, and Q-stick
- 2005Charting put prices beside an equity breakdown
- 2005Range-gated moving-average crossover construction
- 2007Anticipating a simple-average crossover with a threshold-close
- 2007Anticipating moving-average crossovers one bar ahead
- 2007Lead-series moving-average crossovers with a stochastic and relative strength index
- 2007Next-bar SMA crossover hypotheses from theoretical crossing values
- 2007Anticipating a moving-average crossover before confirmation
- 2007A three-horizon moving-average stack as a construction problem
- 2007Confirming trend with regression slope and r-squared
- 2008Constructing a multi-timeframe smoothed crossover
- 2008Best-day clusters versus trend filters
- 2008Allied markets as a confirmation gate for crossover and breakout signals
- 2008Weekly exponential-average crossover as a mechanical trend case study
- 2010Evaluating a 200-day crossover as long, short, and stand-aside rules
- 2010Read a 10-and-40 trend on two neighboring time frames
- 2012Sampling unit as a first-class parameter on dual simple moving averages
- 2012Constructing index-ETF entries from volatility-index persistence
- 2013Moving-average baselines versus crossover signals
- 2013Constructing a typical-price and heikin-ashi crossover as one mechanical procedure
- 2016A three-gate checklist for longs after a sharp drop
- 2016Weekly inflation-ratio crossover for commodity regimes
- 2017Normalized Laguerre zero-axis warning as a two-marker construction
- 2019Range-weighted construction of an adaptive exponential moving average
- 2020Construct a second-pullback entry after a moving-average crossover