2003issue C031-4
Stacked exponential-average retracement entries and extreme stops
An intermediate-term trend is treated as established only when a 150-day exponential-average slope, a 50-day average stacked with that slower line, and a matching swing sequence all agree. A retracement is then studied through two short-span crossovers, with the initial stop parked just beyond the retracement extreme or the setup skipped if that distance already exceeds a pre-set risk ceiling.
- The intermediate-term trend in this construction is framed for a planned hold of one to six months and is treated as established only when the 150-day exponential-average slope, the place of the 50-day average above or below that line, and a matching sequence of swing highs and lows coincide.
- A retracement large enough to study is marked by a 5-day versus 15-day exponential-average crossover against the confirmed trend. The entry is a later 5-day versus 10-day crossover back with that trend.
- The initial stop-loss sits just beyond the retracement extreme: just below a correction low after an upside entry, or just above a rally high after a downside entry.
- If the distance from the intended entry to that stop already exceeds a pre-set risk ceiling, illustrated as 10 percent versus a 12 percent stop distance, the setup is skipped.
A measured retracement inside an intermediate-term trend
This construction is written for participants who typically plan to hold a position for one to six months. The intermediate-term trend is not taken from a single average. It is treated as established only when three conditions coincide: the slope of a 150-day exponential average, the position of a 50-day exponential average relative to that 150-day average, and a matching sequence of swing highs and lows.
A retracement is a temporary move against a still-intact trend, observed as a correction during an advance or a rally during a decline. Exponential-smoothing of daily prices at 5-, 10-, 15-, 50-, and 150-day spans defines the trend stack, the pullback, and the resumption trigger.
The slow stack and the swing sequence
Exponential-smoothing at the 150-day and 50-day spans supplies the slow stack. An uptrend requires an upward 150-day exponential-average slope, the 50-day average above the 150-day average, and a series of higher highs and higher lows. A downtrend requires the inverse stack and a series of lower highs and lower lows.
The slope of the 50-day exponential average is treated as secondary. Only its location above or below the 150-day average is required for the trend stack.
Two successive crossover tests
Once that intermediate-term trend is in place, a pullback large enough to study is marked by a moving-average-crossover of the 5-day exponential average through the 15-day exponential average against the confirmed trend. The 5-day line crossing below the 15-day line flags the counter-move in an uptrend. The 5-day line crossing above the 15-day line flags it in a downtrend.
The entry trigger is a later moving-average-crossover of the 5-day average through the 10-day average, back in the direction of the confirmed trend. Editorial note: the first test admits the retracement; the second test is the only re-entry this workflow offers.
WMT daily: 5-day EMA crosses below 15-day EMA inside a stacked uptrend
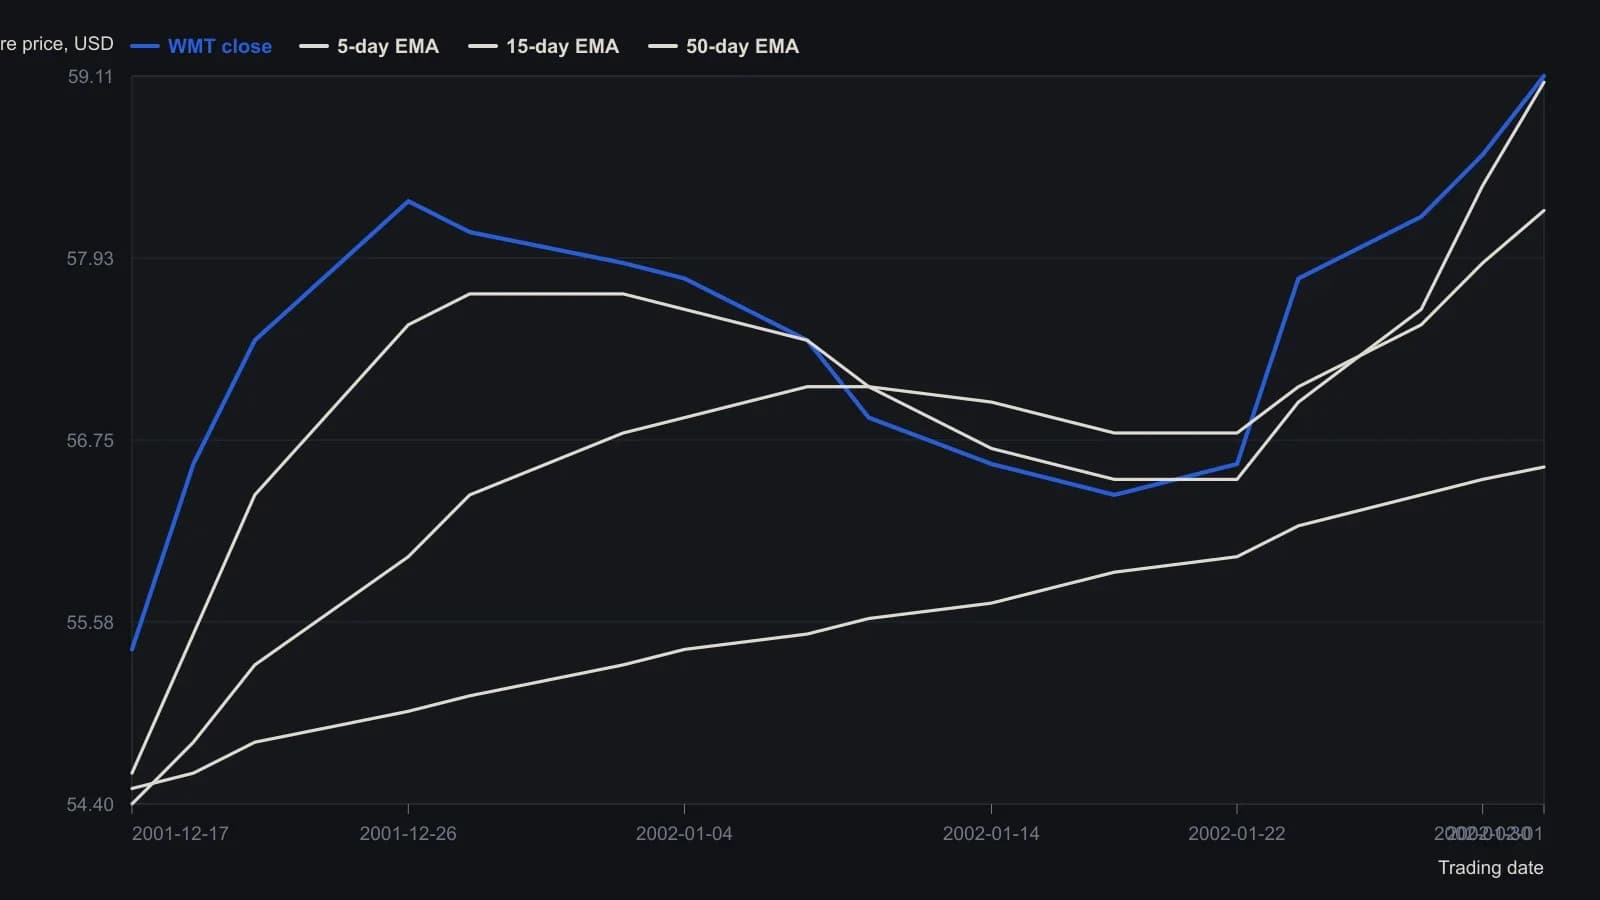
The source marks the 5-day/15-day cross as the first of two short-span tests; the later 5-day/10-day resumption signal is described in the text but is not drawn on this figure. Digitised from the raster at roughly two-to-three-session spacing; last-print EMA and OHLC values are the exact header figures (EMA 150/50/15/5 = 54.09/56.58/58.24/59.07; close 59.11).
Retracement-extreme stop and risk-threshold veto
The initial stop-loss is a retracement-extreme-stop placed just beyond the completed retracement extreme. After an upside entry it sits just below the correction low. After a downside entry it sits just above the rally high.
The same stop-loss also acts as a veto. If the distance from the intended entry to that stop exceeds a pre-set risk ceiling, the setup is skipped rather than entered. The archive illustrates the ceiling as 10 percent against a 12 percent stop distance.
How the three tests sit in order
Editorial sequence: exponential-smoothing builds the intermediate-term trend, marks the retracement, and times the resumption. The two moving-average-crossover tests are the only directional signals in the workflow. The stop-loss either parks invalidation at the retracement extreme or applies the risk-threshold-veto before a position is opened.
All readings on this track · 57 readings
- 1988Constructing moving averages: weights, smoothing and crossovers
- 1988Constructing breadth and average trend states
- 1989Evaluating an always-in-the-market moving-average crossover
- 1989Constructing symmetric market-breadth ratio accumulators
- 1989Objective crossover tests of Fibonacci wave ratios
- 1990Volume-adjusted moving average construction
- 1991Constructing a mechanical crossover on a synthetic price series
- 1991A two-speed breadth reading for intermediate market direction
- 1992A Deutschemark yield map with dual-average and relative-strength timing
- 1992Confirming currency-fund trends with a crossover and a filter
- 1992A moving-average slope filter for crossover signals
- 1992Occupancy and split-sample tests for average crossovers
- 1994Gold-mining seasonality and bond-fund duration switching
- 1994Price oscillator from two moving averages
- 1995Explicit exponential weights and binary entry filters
- 1996Currency futures crossover with slope, bond filter, and stop
- 1996Two-market average crossover entry with a fixed stop
- 1997Construction of a filtered three-average crossover
- 1998Two-group exponential average compression as a trend filter
- 1998Constructing r-squared trend filters with dual lookbacks
- 1998Moving-average length is a habit, not a secret
- 1999Solving the close that triggers a moving-average crossover
- 2000Kagi yang and yin control versus crossover noise
- 2000Constructing simple moving average crossover filters
- 2000Building a vertical-horizontal filter to gate trend signals
- 2000Two-average crossover as a check on trend following
- 2003Stacked exponential-average retracement entries and extreme stops
- 2003Evaluating oscillator thresholds against optimized crossovers
- 2004Constructing a semicycle trend-quality filter
- 2004Commodity subgroups labeled by crossover, support, or convergence
- 2004Full-window evaluation of crossover trend systems
- 2004Two-average trend filters as a classroom critique of indicator stacking
- 2005Three-layer confirmation from a moving-average cross, candles, and Q-stick
- 2005Charting put prices beside an equity breakdown
- 2005Range-gated moving-average crossover construction
- 2007Anticipating a simple-average crossover with a threshold-close
- 2007Anticipating moving-average crossovers one bar ahead
- 2007Lead-series moving-average crossovers with a stochastic and relative strength index
- 2007Next-bar SMA crossover hypotheses from theoretical crossing values
- 2007Anticipating a moving-average crossover before confirmation
- 2007A three-horizon moving-average stack as a construction problem
- 2007Confirming trend with regression slope and r-squared
- 2008Constructing a multi-timeframe smoothed crossover
- 2008Best-day clusters versus trend filters
- 2008Allied markets as a confirmation gate for crossover and breakout signals
- 2008Weekly exponential-average crossover as a mechanical trend case study
- 2010Evaluating a 200-day crossover as long, short, and stand-aside rules
- 2010Read a 10-and-40 trend on two neighboring time frames
- 2012Sampling unit as a first-class parameter on dual simple moving averages
- 2012Constructing index-ETF entries from volatility-index persistence
- 2013Moving-average baselines versus crossover signals
- 2013Constructing a typical-price and heikin-ashi crossover as one mechanical procedure
- 2016A three-gate checklist for longs after a sharp drop
- 2016Weekly inflation-ratio crossover for commodity regimes
- 2017Normalized Laguerre zero-axis warning as a two-marker construction
- 2019Range-weighted construction of an adaptive exponential moving average
- 2020Construct a second-pullback entry after a moving-average crossover