2008issue C041-2
Best-day clusters versus trend filters
A list of the twenty largest one-day S&P 500 advances from 1955 through 2005 places each best day inside a rebound cluster whose adjoining declines were larger than that advance. Editorial reading: a trend-following moving-average crossover should be scored as one mechanical trading system path, not against a fully invested path that only deletes the up days.
- The comparison used the twenty largest one-day S&P 500 advances from 1955 through 2005 rather than only the ten largest days in a ten- or twenty-year window.
- Across that list of twenty, each best day was accompanied by neighboring declines larger than that day's advance.
- Removing the ten, fifteen, or twenty best days from a 1955-to-sample-end fully invested path reduced the ending result, but that comparison does not test whether a timing rule can also avoid the adjoining losses.
- A simple moving-average crossover was described as missing nearly all of those best days together with the larger adjoining declines those days were tied to.
A slogan treated as a rule-design drill
The missed-best-days argument is the claim that a long fully invested path is condemned if a handful of the largest one-day advances are skipped.
Editorial reading: treat that slogan as a rule-design drill for a mechanical trading system. A trend-following moving-average crossover is not graded on whether it captures isolated rebound sessions. It is graded on whether those sessions sit inside rebound clusters whose adjoining declines exceed the rebound.
Twenty best days and their adjoining declines
The comparison used the twenty largest one-day S&P 500 advances from 1955 through 2005 rather than only the ten largest days in a ten- or twenty-year window.
The largest one-day advance in that fifty-year sample was 9.1 percent on 21 October 1987, after a 5.3 percent gain on 20 October 1987 and a one-day drop of more than 20 percent on 19 October 1987.
Several of the next-largest 2002 advances, including 5.7 percent on 24 July and 5.4 percent on 29 July, occurred while the index was recovering from a decline of about 45 percent from the August 2000 peak.
Ranked advances of 5.1 percent on 28 October 1997 and 8 September 1998 each followed nearby declines of 6.9 percent and 6.8 percent.
The 5 percent advance on 27 May 1970 sat inside an 8 May to 1 June stretch that included 13.9 percent of gains and 16.1 percent of losses.
Across the full list of twenty, each best day was accompanied by neighboring declines larger than that day's advance.
Twenty largest one-day S&P 500 advances, 1955–2005
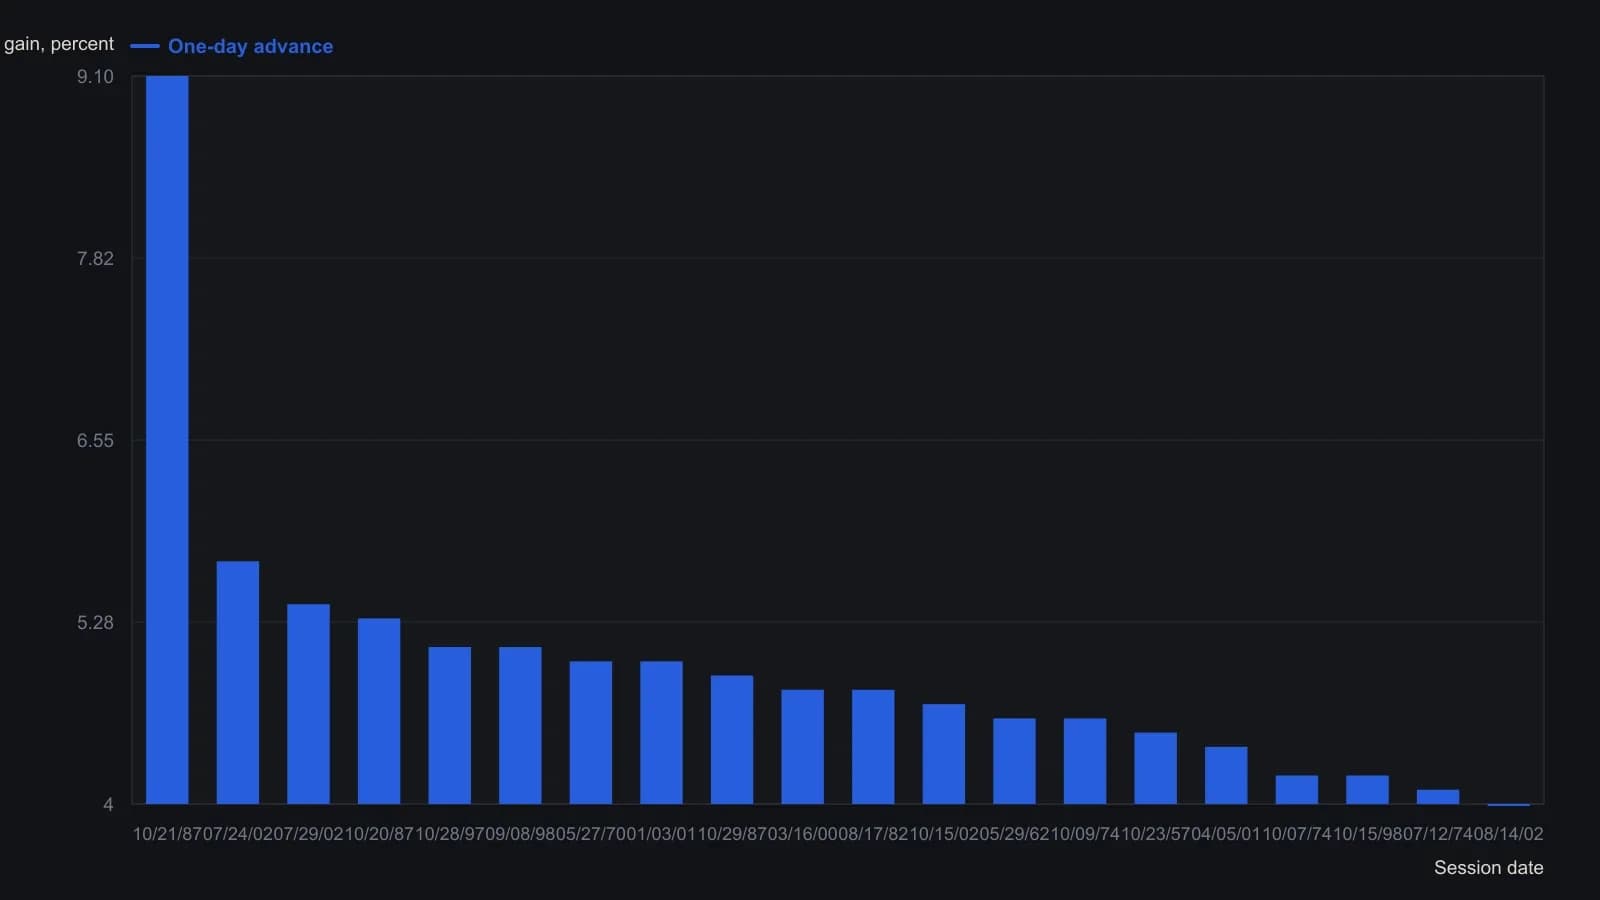
Ahrens ranked the twenty largest one-day S&P 500 gains over fifty years instead of the ten-best-days-in-twenty-years slogan. Neighboring declines are discussed in the text on uneven windows, so they are not plotted beside these one-day percentages.
A fully invested deletion is not a timing test
Removing the ten, fifteen, or twenty best days from a 1955-to-sample-end fully invested path reduced the ending result, but that comparison does not test whether a timing rule can also avoid the adjoining losses.
Editorial reading: a mechanical trading system is a fully specified timing procedure whose signals can be checked as a single path through a sample, rather than as a list of isolated up days. Deleting only the rebound leaves the adjoining decline on the comparison path, so the slogan never asks the question the rule is built to answer.
Scoring a moving-average crossover as one path
A moving-average crossover is a mechanical exposure signal that changes participation when a shorter average of price crosses a longer average, turning a repeatable chart condition into a testable stay-in or stay-out hypothesis.
Trend following treats entry, exit, and abstention as one rule set keyed to market state, so a skipped rebound is judged together with the decline that preceded or followed it.
A simple moving-average crossover was described as missing nearly all of those best days together with the larger adjoining declines those days were tied to.
Editorial reading: that described path is the relevant score for the drill. The question is not whether isolated rebound sessions were captured. The question is whether the rebound cluster, including the larger adjoining decline, was handled as one procedure.
All readings on this track · 57 readings
- 1988Constructing moving averages: weights, smoothing and crossovers
- 1988Constructing breadth and average trend states
- 1989Evaluating an always-in-the-market moving-average crossover
- 1989Constructing symmetric market-breadth ratio accumulators
- 1989Objective crossover tests of Fibonacci wave ratios
- 1990Volume-adjusted moving average construction
- 1991Constructing a mechanical crossover on a synthetic price series
- 1991A two-speed breadth reading for intermediate market direction
- 1992A Deutschemark yield map with dual-average and relative-strength timing
- 1992Confirming currency-fund trends with a crossover and a filter
- 1992A moving-average slope filter for crossover signals
- 1992Occupancy and split-sample tests for average crossovers
- 1994Gold-mining seasonality and bond-fund duration switching
- 1994Price oscillator from two moving averages
- 1995Explicit exponential weights and binary entry filters
- 1996Currency futures crossover with slope, bond filter, and stop
- 1996Two-market average crossover entry with a fixed stop
- 1997Construction of a filtered three-average crossover
- 1998Two-group exponential average compression as a trend filter
- 1998Constructing r-squared trend filters with dual lookbacks
- 1998Moving-average length is a habit, not a secret
- 1999Solving the close that triggers a moving-average crossover
- 2000Kagi yang and yin control versus crossover noise
- 2000Constructing simple moving average crossover filters
- 2000Building a vertical-horizontal filter to gate trend signals
- 2000Two-average crossover as a check on trend following
- 2003Stacked exponential-average retracement entries and extreme stops
- 2003Evaluating oscillator thresholds against optimized crossovers
- 2004Constructing a semicycle trend-quality filter
- 2004Commodity subgroups labeled by crossover, support, or convergence
- 2004Full-window evaluation of crossover trend systems
- 2004Two-average trend filters as a classroom critique of indicator stacking
- 2005Three-layer confirmation from a moving-average cross, candles, and Q-stick
- 2005Charting put prices beside an equity breakdown
- 2005Range-gated moving-average crossover construction
- 2007Anticipating a simple-average crossover with a threshold-close
- 2007Anticipating moving-average crossovers one bar ahead
- 2007Lead-series moving-average crossovers with a stochastic and relative strength index
- 2007Next-bar SMA crossover hypotheses from theoretical crossing values
- 2007Anticipating a moving-average crossover before confirmation
- 2007A three-horizon moving-average stack as a construction problem
- 2007Confirming trend with regression slope and r-squared
- 2008Constructing a multi-timeframe smoothed crossover
- 2008Best-day clusters versus trend filters
- 2008Allied markets as a confirmation gate for crossover and breakout signals
- 2008Weekly exponential-average crossover as a mechanical trend case study
- 2010Evaluating a 200-day crossover as long, short, and stand-aside rules
- 2010Read a 10-and-40 trend on two neighboring time frames
- 2012Sampling unit as a first-class parameter on dual simple moving averages
- 2012Constructing index-ETF entries from volatility-index persistence
- 2013Moving-average baselines versus crossover signals
- 2013Constructing a typical-price and heikin-ashi crossover as one mechanical procedure
- 2016A three-gate checklist for longs after a sharp drop
- 2016Weekly inflation-ratio crossover for commodity regimes
- 2017Normalized Laguerre zero-axis warning as a two-marker construction
- 2019Range-weighted construction of an adaptive exponential moving average
- 2020Construct a second-pullback entry after a moving-average crossover