1990issue C031-12
Diversify markets, not systems, to cut trend-system variance
A historical portfolio simulation applied five technical procedures, including a Price channel and a dual Moving-average crossover, to seven nearby futures series. Adding markets reduced profit variance more than adding similar Trend following procedures, whose aggregate monthly returns were highly correlated.
- A historical simulation applied five technical procedures, including a Price channel and a dual Moving-average crossover, to seven nearby futures series that expanded from two markets in 1960 to equal weights by 1977.
- Parameters were held constant across markets and time. The workflow blocked locked-limit opens, forbade pyramiding, rolled the nearby contract on the first trading day of the expiration month, and treated equity drawdowns as recapitalized.
- Aggregating seven markets reduced return variability and narrowed monthly extremes, while aggregate monthly returns of the dual Moving-average crossover and the Price channel were correlated at 0.83.
- The study concluded that adding markets reduces profit variance more than adding similar Trend following procedures because those procedures' returns are highly correlated.
A historical portfolio test
A historical portfolio simulation applied five technical procedures, including a Price channel and a dual Moving-average crossover, to seven nearby futures series. The portfolio expanded from two markets in 1960 to equal weights by 1977.
Parameters were held constant across markets and time rather than optimized. The stated grounds were that long-horizon results differ little among nearby moving-average pairs, and that longer settings tend to produce slightly higher net results through fewer trades.
How the simulation was run
The simulation blocked entries and exits on locked-limit opens, forbade pyramiding, rolled the nearby contract on the first trading day of the expiration month, and treated equity drawdowns as recapitalized.
Returns were computed on total allocated capital of 30 percent initial margin plus 70 percent reserve, using assumed historical margin rates that differed by market.
Returns, variability, and losing years
Across the 35 market-system combinations, mean annual percent returns averaged 65 percent before a 100-dollar round-turn cost assumption and about 30 percent after that deduction. Even the stronger procedures were negative in about one year in five on the seven-market aggregate.
Commodity-level mean annual percent returns ranged from 77 percent for Deutschemarks to 42 percent for silver. Ranking by coefficient of variation favored corn and sugar over Deutschemarks and cattle because the latter pair had higher return variability.
Among the five procedures, directional parabolic showed the highest mean annual percent return at 100 percent and the lowest coefficient of variation at 67. The Price channel and dual Moving-average crossover posted 70 percent and 63 percent, with coefficients of variation of 74 and 94.
Monthly evidence and single-market extremes
Monthly returns were positive and statistically distinguishable from zero at the 5 percent level in 20 of 35 individual market-system cases and in every aggregate case. Single-market extremes included a channel monthly low of -419 percent and a filter-rule monthly high of 322 percent, both in soybeans.
What aggregation changed
Aggregating seven markets reduced return variability. The Relative Strength Index coefficient of variation dropped from an individual-market average of 1236 to 499. The directional-parabolic coefficient of variation dropped from 610 to 242. Overall monthly extremes narrowed from -419 percent and 322 percent to -46 percent and 139 percent.
Aggregate monthly returns of the dual Moving-average crossover and the Price channel were correlated at 0.83. The study concluded that adding markets reduces profit variance more than adding similar Trend following procedures because those procedures' returns are highly correlated.
Annual return variability by market versus the seven-futures book
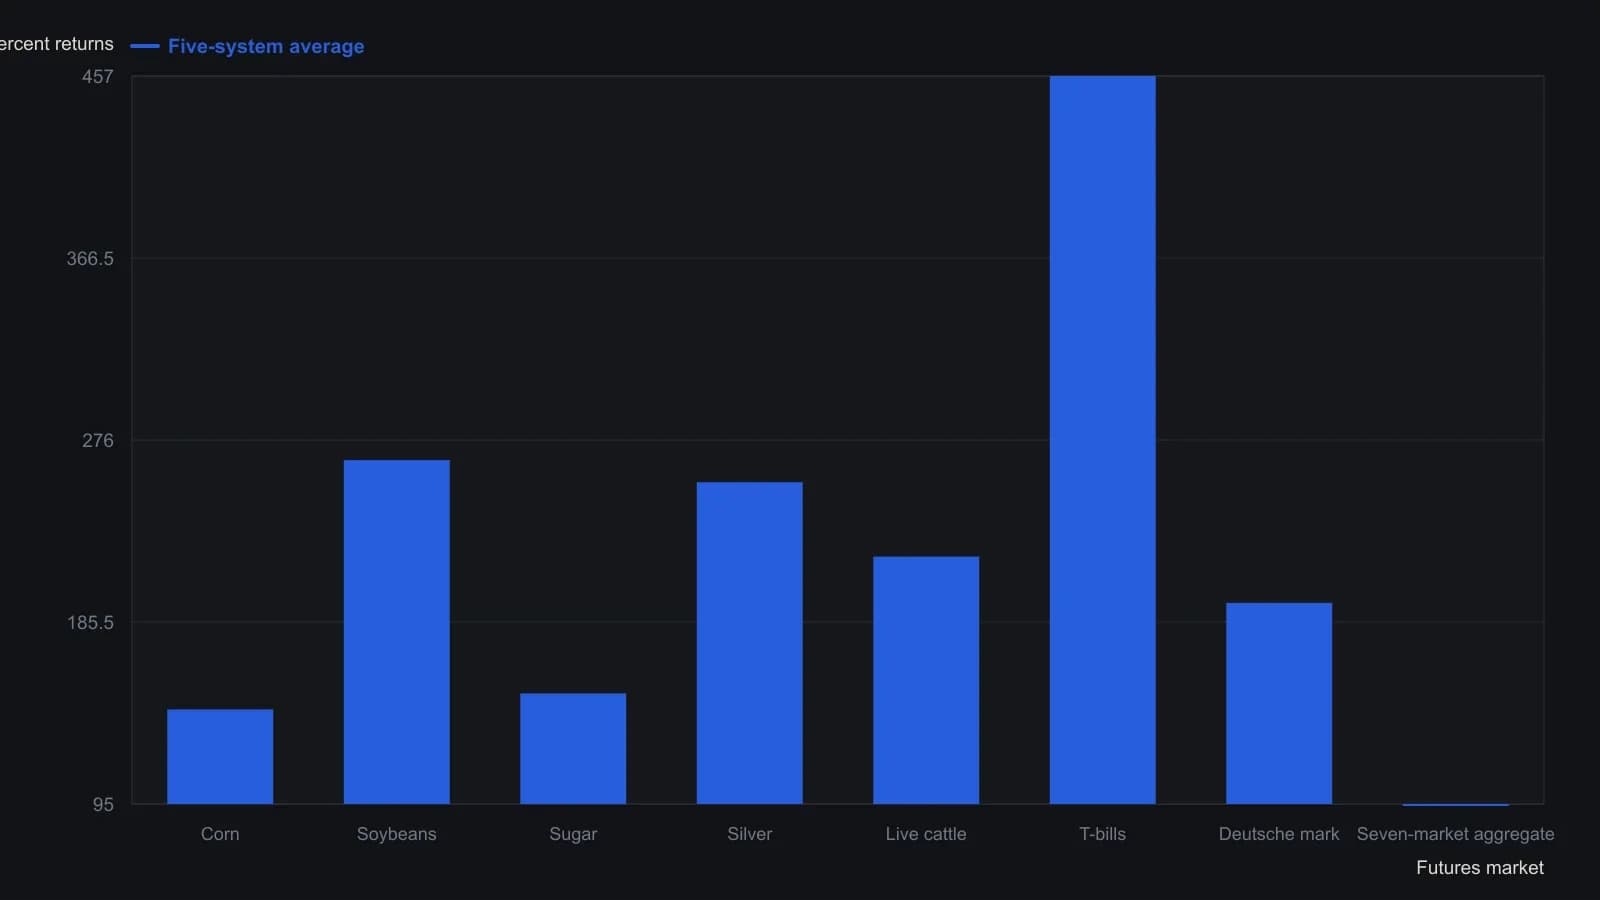
Parameters were typical trader settings held fixed across markets and years, not optimized in sample. Each series starts when that contract is available (corn and soybeans in 1960; sugar and silver in 1964; live cattle in 1966; T-bills and the Deutsche mark in 1977), so the aggregate is time-weighted—half corn and half soybeans in 1960, one-seventh each from 1977—not a simple mean of the rows above it. Figures are gross of a $100 round-turn charge, which the authors say would cut the related mean returns by about half.
All readings on this track · 55 readings
- 1988Constructing price channels from trendlines
- 1988Three-point curved trend channel construction
- 1988Least-squares construction of channel trendlines
- 1988Three-zone price channel from quadratic smoothing
- 1989A variable-sensitivity stochastic built on three-sigma bounds
- 1989Close-minus-average oscillator for channel extremes
- 1989The six-stage hunt as a critique of one-click heroics
- 1990Fair-value gaps and a copper moving-average channel
- 1990Diversify markets, not systems, to cut trend-system variance
- 1991Constructing trendlines, price channels, and close-based breakouts
- 1991Constructing seasonal-cycle overlays with channel confirmation
- 1993Lag-compensated exponential trend channel construction
- 1993Constructing a lead-lag filter and price channel as one stack
- 1993Three stochastic warnings still need price-channel confirmation
- 1993Lead-lag smoothing for weekly trend-channel construction
- 1993Constructing zero-net-lag price channels
- 1995From a downtrend-line break to a regression channel
- 1995Validated trendline and price channel construction
- 1995Constructing price envelopes from averages, volatility, and regression
- 1996Constructing trendlines and channels from explicit swings
- 1998Fifty percent retracement as a channel regime test
- 1998Close-based channel rails as daily scenario maps
- 1999Constructing support, resistance, trendlines, and price channels
- 2001Cycle composites, price channels, and two-sided signals
- 2001Testing horizontal price channels with stops and scale
- 2002A two-stage momentum-shift and price-channel process
- 2002Wave-by-wave channel construction for Elliott counts
- 2002Affine channels as reusable trade hypotheses
- 2004Stress-test seasonal windows across regimes, then add channels
- 2004Regime permission from trendlines, channels, and range edges
- 2004Weekly-average and price-channel states on sector depositary baskets
- 2005Oil services catch-up after channel resistance breaks
- 2005Constructing a volatility-normalized cycle index
- 2005How a Darvas channel becomes a complete entry and exit procedure
- 2005Clustered Fibonacci and channel levels in news-driven forex
- 2005Treat a consolidating currency market as a time-frame problem
- 2005Channel walls that flip roles or recapture price
- 2006Stacking candlesticks, crossovers, and price channels
- 2006Failed uptrend channel breakout left the euro rangebound
- 2006Constructing a Wilson relative price channel from a range-bound strength index
- 2007Range bars change when a Bollinger squeeze counts as a breakout
- 2009One testable SPY procedure for a price channel, a trend rule, and a seasonal overlay
- 2010A gold-miner channel plan from value to false breakouts
- 2010A multi-timeframe channel from value to an overvalued zone
- 2010Asymmetric price channel construction for congested markets
- 2011Phasing many cycles at once with nested envelopes
- 2012Constructing adaptive horizontal price channels
- 2014Confirming support with trendlines, channels, and retracements
- 2015News-sentiment confirmation for support, channel, and volume tests
- 2015A three-layer permission stack: moving averages, a price channel, and weekly levels
- 2016Entropy-diff as a regime switch between trend following and a price channel
- 2017Competing rulers on a pound chart after Brexit
- 2017Test consolidation channel breakouts as one procedure
- 2020Constructing late-trend longs with a price channel, gap breakout, and trailing stop
- 2025Using IBM's multi-year price channel as a breakout teaching case