1988issue C031-7
Constructing moving averages: weights, smoothing and crossovers
A moving average is a constructed series that replaces raw observations with a rolling blend of current and prior values. Equal-weight windows, exponential decay and two-line crossovers each set different weights, a different intended signal and a different lag. Those choices belong in the specification before the line is read as a reversal or a trade hypothesis.
- A simple moving average is the equal-weight arithmetic mean of a fixed lookback. It advances by adding the newest observation and deleting the oldest, so a longer periodicity lowers each observation's weight and smooths the series.
- An exponential average is specified by a smoothing constant rather than a finite observation count. Every earlier observation remains with a successively smaller geometric weight, and a smaller constant produces a smoother path.
- A shorter, more volatile average crossing a longer, smoother average is constructed as a buy or sell hypothesis that short-horizon direction has diverged from long-horizon direction.
- Smoother constructions produce fewer crossover signals and respond later. Pairings chosen because they looked best on past data describe that sample and do not establish that the same pairing will be best later.
A constructed series
A moving average is a constructed series that replaces raw observations with a rolling blend of current and prior values so direction is easier to inspect and a reversal can be judged against a benchmark.
Equal-weight windows
A simple moving average assigns each date the arithmetic mean of a fixed number of successive observations and then updates by including the newest observation while removing the oldest.
Periodicity is the chosen number of sampling intervals in a simple average. A longer setting lowers each observation's weight and increases smoothness.
In a three-period simple average each included observation has weight one-third, whereas in a nine-period simple average each has weight one-ninth, so a longer lookback reduces the influence of any single extreme observation.
Increasing the number of observations in a simple moving average produces a smoother series because each individual data point contributes less to the current value.
Exponential decay
An exponential moving average is specified by a smoothing constant rather than by a finite observation count, because every earlier observation remains in the value with successively smaller geometric weight.
The smoothing constant is the parameter that sets how much of each exponential update comes from the newest observation versus the previous exponential average.
Once a prior exponential average exists, the next value equals the smoothing constant times the newest observation plus one minus that constant times the previous exponential average.
An exponential average with a smoothing constant of one-third is more volatile than one with a smoothing constant of one-ninth, matching the rule that smaller per-observation weight yields a smoother path.
Support, resistance and reversal penetration
A moving average can serve as a constructed support or resistance reference, and a penetration through that line can be treated as confirmation that a reversal may have begun.
That one-line rule is a reversal penetration: a move through the average itself is treated as confirmation that direction may have changed.
Dual-horizon crossovers
A moving-average crossover is a two-line rule in which a shorter, more volatile average crossing a longer, smoother average is treated as a hypothesis that short-horizon and long-horizon direction have diverged.
A shorter, more volatile average crossing a longer, smoother average is constructed as a signal that the short-horizon direction has diverged from the long-horizon direction. An upside cross is the buy hypothesis and a downside cross is the sell hypothesis.
Smoother constructions, whether from longer periodicity or a smaller smoothing constant, produce fewer crossover signals and respond later than more volatile constructions.
What a historical pairing does not establish
Choosing periodicities or smoothing constants by which pairing looked best on past data describes that historical sample and does not establish that the same pairing will be best later.
The intended holding horizon and tolerance for false signals remain the design constraints.
September 1987 T-bond futures with 20-day and 40-day simple moving averages
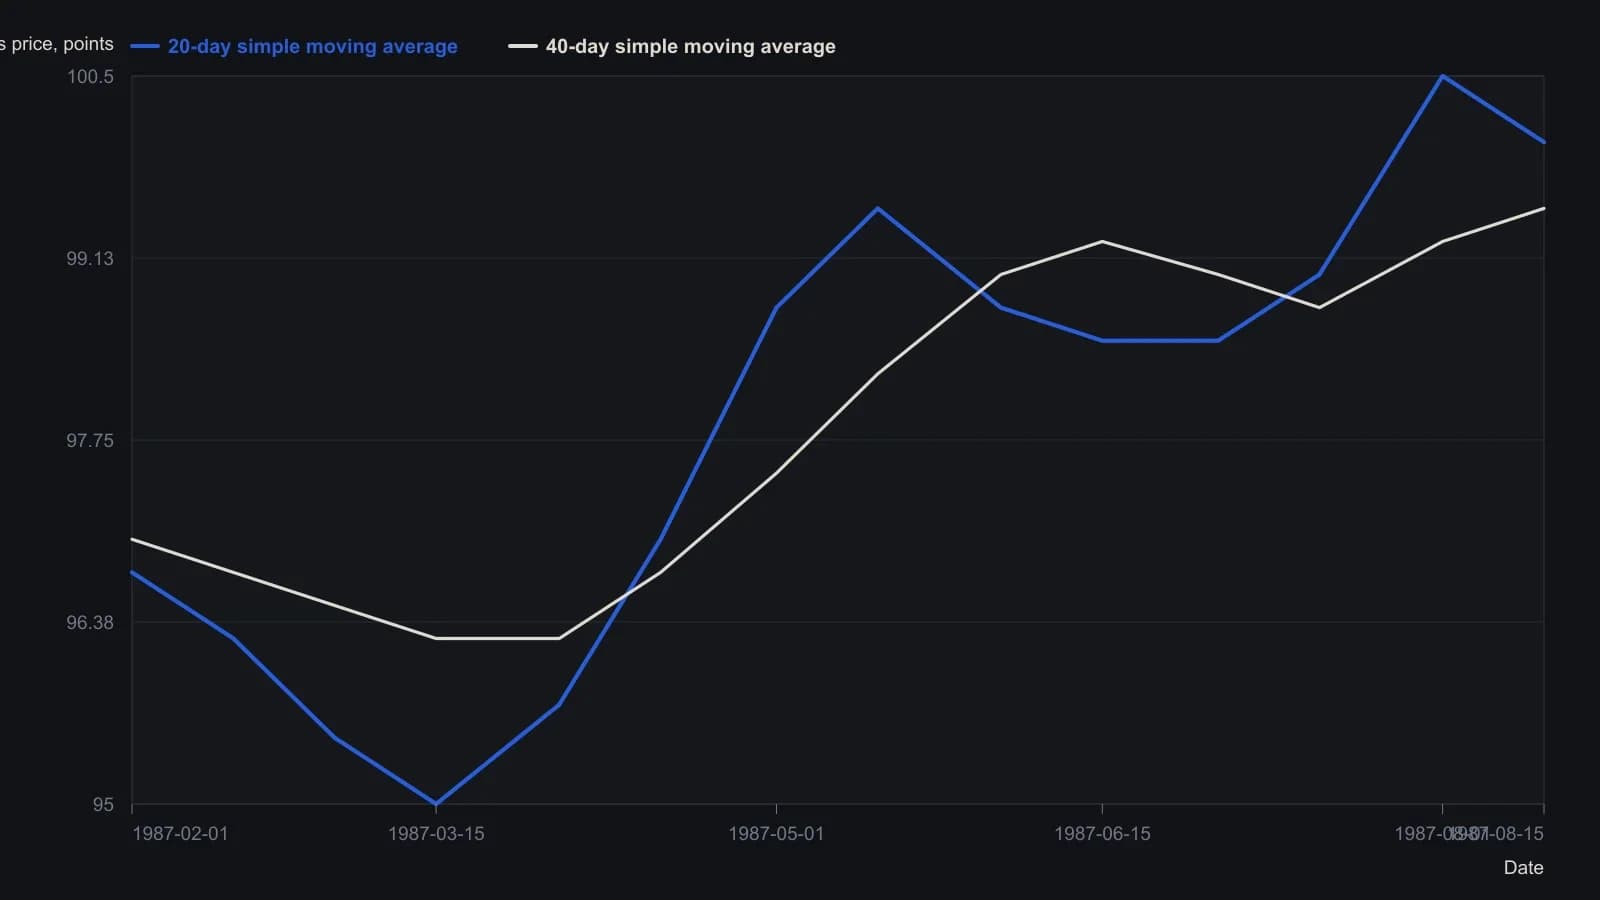
Daily closes are not tabulated in the source. Points are the two plotted simple moving averages, read from the axis (bond points, 93–102) at roughly two-week steps. Precision is limited to about a quarter-point by the scan.
All readings on this track · 57 readings
- 1988Constructing moving averages: weights, smoothing and crossovers
- 1988Constructing breadth and average trend states
- 1989Evaluating an always-in-the-market moving-average crossover
- 1989Constructing symmetric market-breadth ratio accumulators
- 1989Objective crossover tests of Fibonacci wave ratios
- 1990Volume-adjusted moving average construction
- 1991Constructing a mechanical crossover on a synthetic price series
- 1991A two-speed breadth reading for intermediate market direction
- 1992A Deutschemark yield map with dual-average and relative-strength timing
- 1992Confirming currency-fund trends with a crossover and a filter
- 1992A moving-average slope filter for crossover signals
- 1992Occupancy and split-sample tests for average crossovers
- 1994Gold-mining seasonality and bond-fund duration switching
- 1994Price oscillator from two moving averages
- 1995Explicit exponential weights and binary entry filters
- 1996Currency futures crossover with slope, bond filter, and stop
- 1996Two-market average crossover entry with a fixed stop
- 1997Construction of a filtered three-average crossover
- 1998Two-group exponential average compression as a trend filter
- 1998Constructing r-squared trend filters with dual lookbacks
- 1998Moving-average length is a habit, not a secret
- 1999Solving the close that triggers a moving-average crossover
- 2000Kagi yang and yin control versus crossover noise
- 2000Constructing simple moving average crossover filters
- 2000Building a vertical-horizontal filter to gate trend signals
- 2000Two-average crossover as a check on trend following
- 2003Stacked exponential-average retracement entries and extreme stops
- 2003Evaluating oscillator thresholds against optimized crossovers
- 2004Constructing a semicycle trend-quality filter
- 2004Commodity subgroups labeled by crossover, support, or convergence
- 2004Full-window evaluation of crossover trend systems
- 2004Two-average trend filters as a classroom critique of indicator stacking
- 2005Three-layer confirmation from a moving-average cross, candles, and Q-stick
- 2005Charting put prices beside an equity breakdown
- 2005Range-gated moving-average crossover construction
- 2007Anticipating a simple-average crossover with a threshold-close
- 2007Anticipating moving-average crossovers one bar ahead
- 2007Lead-series moving-average crossovers with a stochastic and relative strength index
- 2007Next-bar SMA crossover hypotheses from theoretical crossing values
- 2007Anticipating a moving-average crossover before confirmation
- 2007A three-horizon moving-average stack as a construction problem
- 2007Confirming trend with regression slope and r-squared
- 2008Constructing a multi-timeframe smoothed crossover
- 2008Best-day clusters versus trend filters
- 2008Allied markets as a confirmation gate for crossover and breakout signals
- 2008Weekly exponential-average crossover as a mechanical trend case study
- 2010Evaluating a 200-day crossover as long, short, and stand-aside rules
- 2010Read a 10-and-40 trend on two neighboring time frames
- 2012Sampling unit as a first-class parameter on dual simple moving averages
- 2012Constructing index-ETF entries from volatility-index persistence
- 2013Moving-average baselines versus crossover signals
- 2013Constructing a typical-price and heikin-ashi crossover as one mechanical procedure
- 2016A three-gate checklist for longs after a sharp drop
- 2016Weekly inflation-ratio crossover for commodity regimes
- 2017Normalized Laguerre zero-axis warning as a two-marker construction
- 2019Range-weighted construction of an adaptive exponential moving average
- 2020Construct a second-pullback entry after a moving-average crossover