2016issue C0918-19
Weekly inflation-ratio crossover for commodity regimes
A weekly short-versus-long moving-average comparison on an inflation-expectation ratio is built as a market-based inflation label, then read only as intermarket context for how energy, gold, and the dollar tend to cluster.
- Commodities are treated as everyday production inputs, so inflation measures are described as moving closely with food and energy prices.
- Official consumer-price indexes are characterized as backward-looking; the inflation-expectation ratio of inflation-protected Treasuries to similar-maturity Treasuries is offered as a market-based gauge.
- The nine-by-thirty-six weekly crossover is a disinflationary reading when the short average stays below the long average, and a rising-inflation reading when the short average crosses above.
- The same weekly cross is used as intermarket inflation context with the commodity-dollar inverse, not as a stand-alone call on one commodity.
Everyday inputs and inflation measures
Commodities are treated as everyday production inputs, so inflation measures are described as moving closely with food and energy prices.
Official consumer-price indexes are characterized as backward-looking. A ratio of inflation-protected Treasuries to similar-maturity Treasuries is offered instead as a market-based inflation-expectation gauge. That relative strength is the inflation-expectation ratio.
An advance in the inflation-protected-to-nominal Treasury ratio is interpreted as investors expecting higher future inflation.
One chart of major US inflation influences
The construction is checked by placing oil, the US dollar, gold, and the inflation-expectation ratio on one chart of major US inflation influences beginning in early 2007.
On that chart, energy, gold, and the inflation-expectation ratio appear to move together. The dollar moves inversely, because commodities are typically priced in dollars. That opposite path is the commodity-dollar inverse: commodity prices and the dollar tend to move in opposite directions.
The nine-by-thirty-six weekly crossover
The system is defined on a weekly chart as the relationship between a nine-week (45-day) moving average and a 36-week (180-day) moving average of the inflation-expectation ratio. That comparison is the nine-by-thirty-six weekly crossover.
A short average below the long average is a disinflationary reading and is labeled expected disinflation. A short-average cross above the long average is a rising-inflation reading and is labeled rising inflation expectations.
Crosses over the prior decade
Three inflation-expectation cycles over the prior decade are marked by those crosses. One is a 2007 to 2008 decline. A June 2009 upside cross framed mostly higher expectations through 2013, except for a three-month downside cross in 2010. An early-2013 downside cross followed a prospective monetary-tightening announcement.
Intermarket inflation context
The same weekly cross is used as intermarket inflation context. The bond-market inflation label is read together with dollar, energy, and gold conditions rather than used to forecast a single commodity in isolation.
The crisis-era downside regime is paired with a shift away from commodity-related holdings toward the dollar. The 2013 downside cross is paired with later weakness across energy, precious metals, and agricultural products, plus a stronger dollar.
Weekly TIP/IEI nine- versus 36-week average
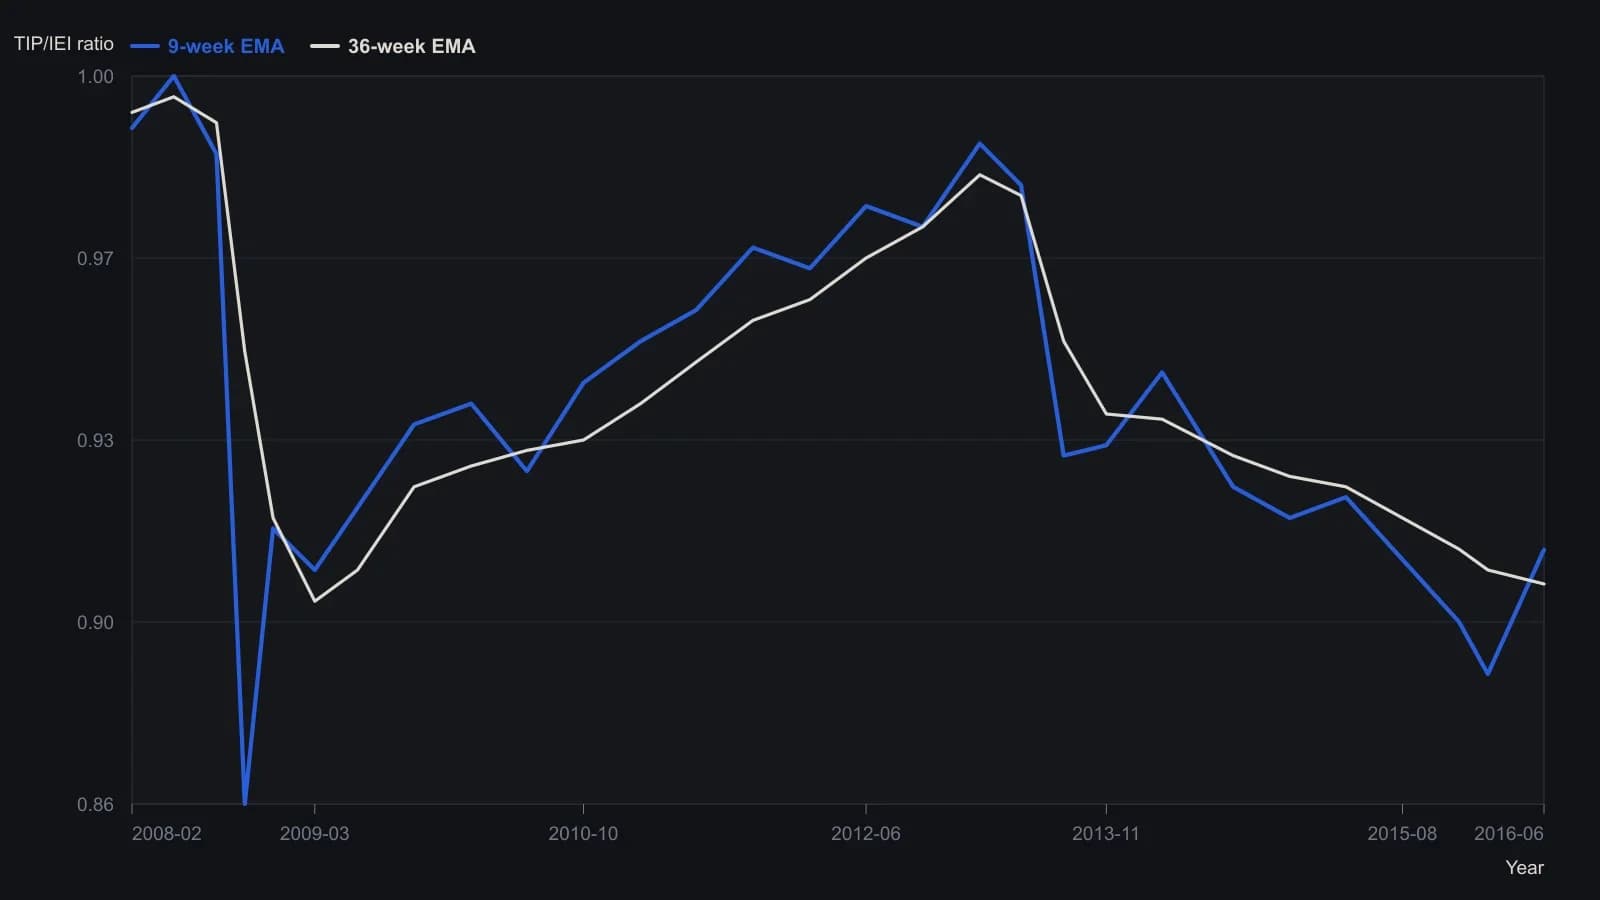
The source uses exponential averages of weekly closes (9-week / 45-day and 36-week / 180-day). Mid-sample values are approximate visual readings from the raster, not a table.
All readings on this track · 57 readings
- 1988Constructing moving averages: weights, smoothing and crossovers
- 1988Constructing breadth and average trend states
- 1989Evaluating an always-in-the-market moving-average crossover
- 1989Constructing symmetric market-breadth ratio accumulators
- 1989Objective crossover tests of Fibonacci wave ratios
- 1990Volume-adjusted moving average construction
- 1991Constructing a mechanical crossover on a synthetic price series
- 1991A two-speed breadth reading for intermediate market direction
- 1992A Deutschemark yield map with dual-average and relative-strength timing
- 1992Confirming currency-fund trends with a crossover and a filter
- 1992A moving-average slope filter for crossover signals
- 1992Occupancy and split-sample tests for average crossovers
- 1994Gold-mining seasonality and bond-fund duration switching
- 1994Price oscillator from two moving averages
- 1995Explicit exponential weights and binary entry filters
- 1996Currency futures crossover with slope, bond filter, and stop
- 1996Two-market average crossover entry with a fixed stop
- 1997Construction of a filtered three-average crossover
- 1998Two-group exponential average compression as a trend filter
- 1998Constructing r-squared trend filters with dual lookbacks
- 1998Moving-average length is a habit, not a secret
- 1999Solving the close that triggers a moving-average crossover
- 2000Kagi yang and yin control versus crossover noise
- 2000Constructing simple moving average crossover filters
- 2000Building a vertical-horizontal filter to gate trend signals
- 2000Two-average crossover as a check on trend following
- 2003Stacked exponential-average retracement entries and extreme stops
- 2003Evaluating oscillator thresholds against optimized crossovers
- 2004Constructing a semicycle trend-quality filter
- 2004Commodity subgroups labeled by crossover, support, or convergence
- 2004Full-window evaluation of crossover trend systems
- 2004Two-average trend filters as a classroom critique of indicator stacking
- 2005Three-layer confirmation from a moving-average cross, candles, and Q-stick
- 2005Charting put prices beside an equity breakdown
- 2005Range-gated moving-average crossover construction
- 2007Anticipating a simple-average crossover with a threshold-close
- 2007Anticipating moving-average crossovers one bar ahead
- 2007Lead-series moving-average crossovers with a stochastic and relative strength index
- 2007Next-bar SMA crossover hypotheses from theoretical crossing values
- 2007Anticipating a moving-average crossover before confirmation
- 2007A three-horizon moving-average stack as a construction problem
- 2007Confirming trend with regression slope and r-squared
- 2008Constructing a multi-timeframe smoothed crossover
- 2008Best-day clusters versus trend filters
- 2008Allied markets as a confirmation gate for crossover and breakout signals
- 2008Weekly exponential-average crossover as a mechanical trend case study
- 2010Evaluating a 200-day crossover as long, short, and stand-aside rules
- 2010Read a 10-and-40 trend on two neighboring time frames
- 2012Sampling unit as a first-class parameter on dual simple moving averages
- 2012Constructing index-ETF entries from volatility-index persistence
- 2013Moving-average baselines versus crossover signals
- 2013Constructing a typical-price and heikin-ashi crossover as one mechanical procedure
- 2016A three-gate checklist for longs after a sharp drop
- 2016Weekly inflation-ratio crossover for commodity regimes
- 2017Normalized Laguerre zero-axis warning as a two-marker construction
- 2019Range-weighted construction of an adaptive exponential moving average
- 2020Construct a second-pullback entry after a moving-average crossover