1990issue C031-6
Volume-adjusted moving average construction
A time-based moving average assigns each session one price observation, whether activity is light or heavy. A volume-adjusted average posts the session midpoint on volume increments so a fast and slow pair averages turnover rather than calendar days.
- A time-based moving average assigns each session the same weight of one price observation, whether activity that session is light or heavy.
- A volume-adjusted average posts the session midpoint once for each volume increment the session occupies, then averages those posts over a chosen number of increments instead of a chosen number of days.
- An 8-volume average is used as a fast locator of current price and a 55-volume average as a slower reference; crossings of the two mark hypothesized changes of character.
- Heavy-volume boxes can stall the faster average or pull it quickly, so a moving-average crossover may become visible earlier or later than it would under equal-day weighting.
Equal weight by session
A moving average is a smoother that averages ordered price observations over a defined lookback so shorter swings recede and the resulting path can be compared with later observations. In the time-based form of that smoother, each session receives the same weight of one price observation, whether activity that session is light or heavy.
Crossovers of two differently parameterized moving averages are presented as candidate turning-point signals. A moving-average crossover is a hypothesized turning-point marker formed when a faster average and a slower average change order. It is used as a chart condition to test, not as a complete decision rule.
Equivolume boxes
Equivolume construction draws each session as an equivolume box: a rectangle whose height is the high-low range and whose width is that session's volume. Equal horizontal distances then represent similar turnover rather than similar elapsed time.
The volume increment is the chosen unit of turnover that sizes a session on the horizontal axis and decides how many times that session's midpoint enters the average.
Posting the session midpoint
The session midpoint is the session high plus the session low, divided by two. It is the price value posted into the volume-adjusted average.
A volume-adjusted average is a moving average whose lookback is counted in volume increments, with each session midpoint posted once for every increment that session occupies. Those midpoint posts are then averaged over a chosen number of volume increments instead of a chosen number of days.
With a 100,000-share increment, a 97,500-share session contributes one midpoint post and a 454,300-share session contributes five.
A 20-volume or 55-volume lookback has no fixed calendar length because volume and time are not interchangeable.
Fast and slow volume averages
An 8-volume average is used as a fast locator of current price and a 55-volume average as a slower reference. Crossings of the two are used to mark hypothesized changes of character.
Heavy-volume boxes can stall the faster average or pull it quickly, so a crossover may become visible earlier or later than it would under equal-day weighting.
Supporting volume-price context
Volume-price analysis reads session importance from the pairing of range and turnover, including box width, compact wide sessions, and expanding or contracting activity around the averages.
Wide compact sessions, contracting volume, expanding range, and the gap between the two averages are treated as supporting volume-price context, not as a complete decision system.
Volume-adjusted averages of posted session midpoints
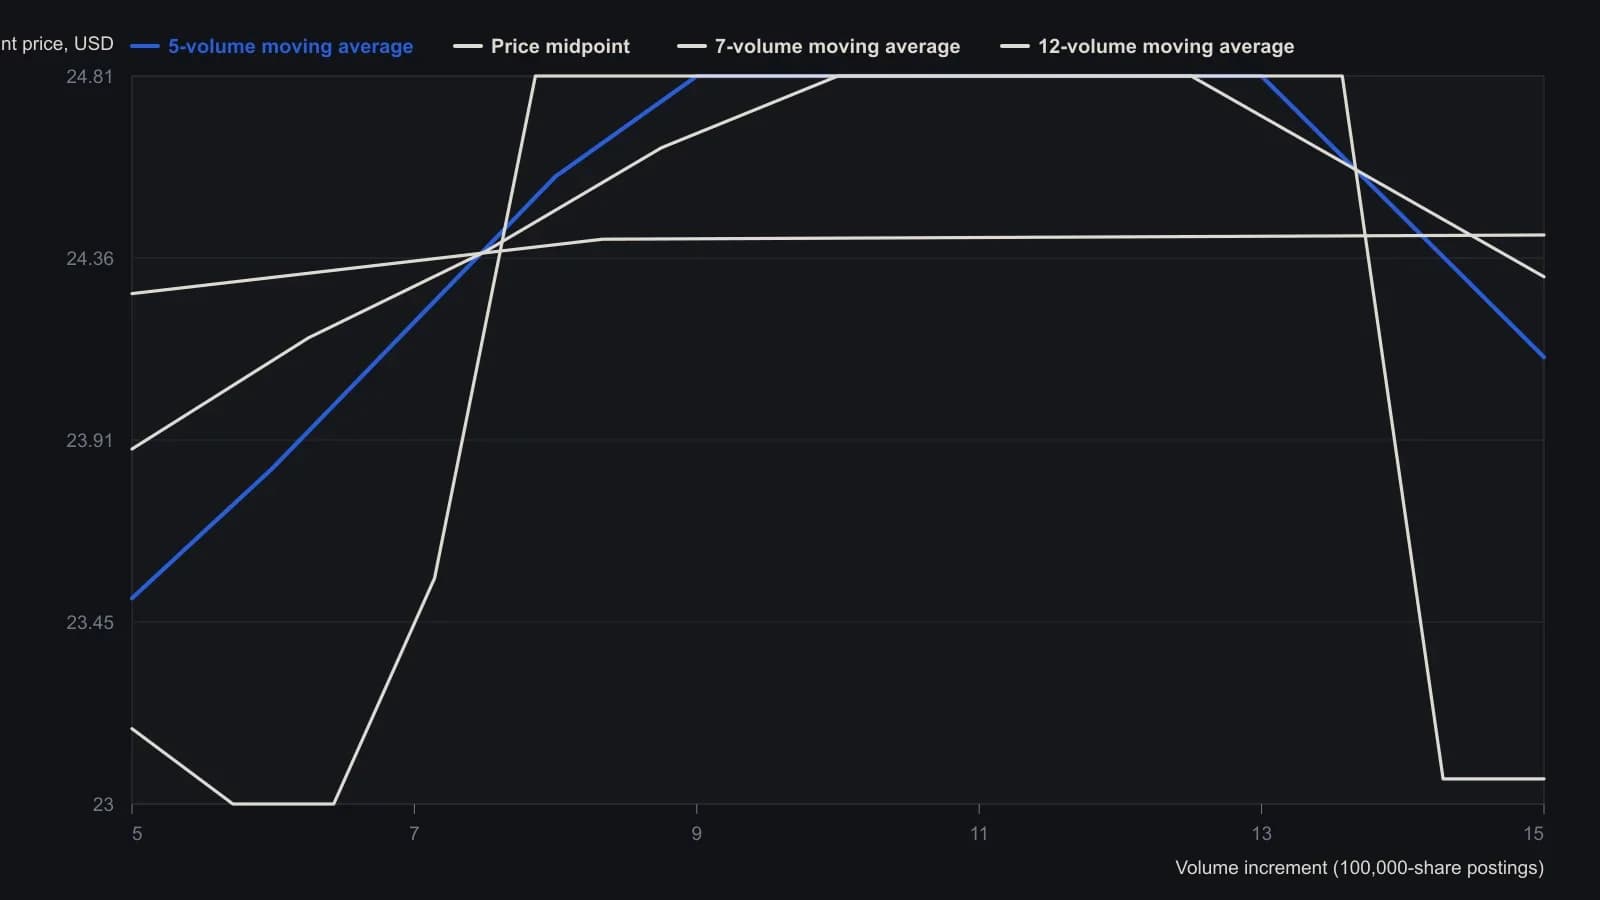
Each session is posted once for every 100,000 shares or any fraction of that increment. The 5-, 7- and 12-volume averages are simple means of the prior 5, 7 and 12 midpoint postings, not calendar days.
All readings on this track · 57 readings
- 1988Constructing moving averages: weights, smoothing and crossovers
- 1988Constructing breadth and average trend states
- 1989Evaluating an always-in-the-market moving-average crossover
- 1989Constructing symmetric market-breadth ratio accumulators
- 1989Objective crossover tests of Fibonacci wave ratios
- 1990Volume-adjusted moving average construction
- 1991Constructing a mechanical crossover on a synthetic price series
- 1991A two-speed breadth reading for intermediate market direction
- 1992A Deutschemark yield map with dual-average and relative-strength timing
- 1992Confirming currency-fund trends with a crossover and a filter
- 1992A moving-average slope filter for crossover signals
- 1992Occupancy and split-sample tests for average crossovers
- 1994Gold-mining seasonality and bond-fund duration switching
- 1994Price oscillator from two moving averages
- 1995Explicit exponential weights and binary entry filters
- 1996Currency futures crossover with slope, bond filter, and stop
- 1996Two-market average crossover entry with a fixed stop
- 1997Construction of a filtered three-average crossover
- 1998Two-group exponential average compression as a trend filter
- 1998Constructing r-squared trend filters with dual lookbacks
- 1998Moving-average length is a habit, not a secret
- 1999Solving the close that triggers a moving-average crossover
- 2000Kagi yang and yin control versus crossover noise
- 2000Constructing simple moving average crossover filters
- 2000Building a vertical-horizontal filter to gate trend signals
- 2000Two-average crossover as a check on trend following
- 2003Stacked exponential-average retracement entries and extreme stops
- 2003Evaluating oscillator thresholds against optimized crossovers
- 2004Constructing a semicycle trend-quality filter
- 2004Commodity subgroups labeled by crossover, support, or convergence
- 2004Full-window evaluation of crossover trend systems
- 2004Two-average trend filters as a classroom critique of indicator stacking
- 2005Three-layer confirmation from a moving-average cross, candles, and Q-stick
- 2005Charting put prices beside an equity breakdown
- 2005Range-gated moving-average crossover construction
- 2007Anticipating a simple-average crossover with a threshold-close
- 2007Anticipating moving-average crossovers one bar ahead
- 2007Lead-series moving-average crossovers with a stochastic and relative strength index
- 2007Next-bar SMA crossover hypotheses from theoretical crossing values
- 2007Anticipating a moving-average crossover before confirmation
- 2007A three-horizon moving-average stack as a construction problem
- 2007Confirming trend with regression slope and r-squared
- 2008Constructing a multi-timeframe smoothed crossover
- 2008Best-day clusters versus trend filters
- 2008Allied markets as a confirmation gate for crossover and breakout signals
- 2008Weekly exponential-average crossover as a mechanical trend case study
- 2010Evaluating a 200-day crossover as long, short, and stand-aside rules
- 2010Read a 10-and-40 trend on two neighboring time frames
- 2012Sampling unit as a first-class parameter on dual simple moving averages
- 2012Constructing index-ETF entries from volatility-index persistence
- 2013Moving-average baselines versus crossover signals
- 2013Constructing a typical-price and heikin-ashi crossover as one mechanical procedure
- 2016A three-gate checklist for longs after a sharp drop
- 2016Weekly inflation-ratio crossover for commodity regimes
- 2017Normalized Laguerre zero-axis warning as a two-marker construction
- 2019Range-weighted construction of an adaptive exponential moving average
- 2020Construct a second-pullback entry after a moving-average crossover