2000issue C071-5
Building a vertical-horizontal filter to gate trend signals
A two-layer construction starts with a vertical-horizontal filter that classifies trending versus congested conditions. Only after that regime is set does a trend filter allow a moving-average crossover to locate entries and exits.
- The vertical-horizontal filter is built to classify a market as trending or congested so a different indicator family can be applied. It is not a standalone buy or sell signal.
- A common construction uses a 28-period window. The numerator is the difference between the highest and lowest close, and the denominator is the sum of absolute one-period close changes.
- When the filter is rising, a moving-average crossover can be attached as a trend-following overlay. When the filter is declining, that overlay is withdrawn in favor of a congestion-phase tool.
- A regime-benchmark may be a band near 0.3 to 0.38 or the filter's own congestion-range high. No single benchmark travels well across securities.
Build the regime layer first
The vertical-horizontal filter is built to classify a market as trending or congested so a different indicator family can be applied. It is not constructed as a standalone buy or sell signal.
Editorial note: TradersWeek treats that classification as the first construction step in a two-layer system. A trend filter then decides whether trend-following tactics are even in force.
Assemble the lookback ratio
A common construction uses a 28-period window. The numerator is the difference between the highest and lowest close in that window. The denominator is the sum of absolute one-period close changes.
The result is a lookback ratio of net high-to-low close travel over those one-period changes. It is used to judge whether price is in a trending or congested regime.
Read rise, fall, and congestion without a direction
A rising reading is treated as strengthening trend activity. A falling or relatively flat reading is treated as a weakening trend or a congestion-phase.
The filter does not encode direction. It can rise in both advances and declines because it measures the size of vertical close travel, not its sign.
Dell VHF regime filter, Dec 1998–Mar 1999
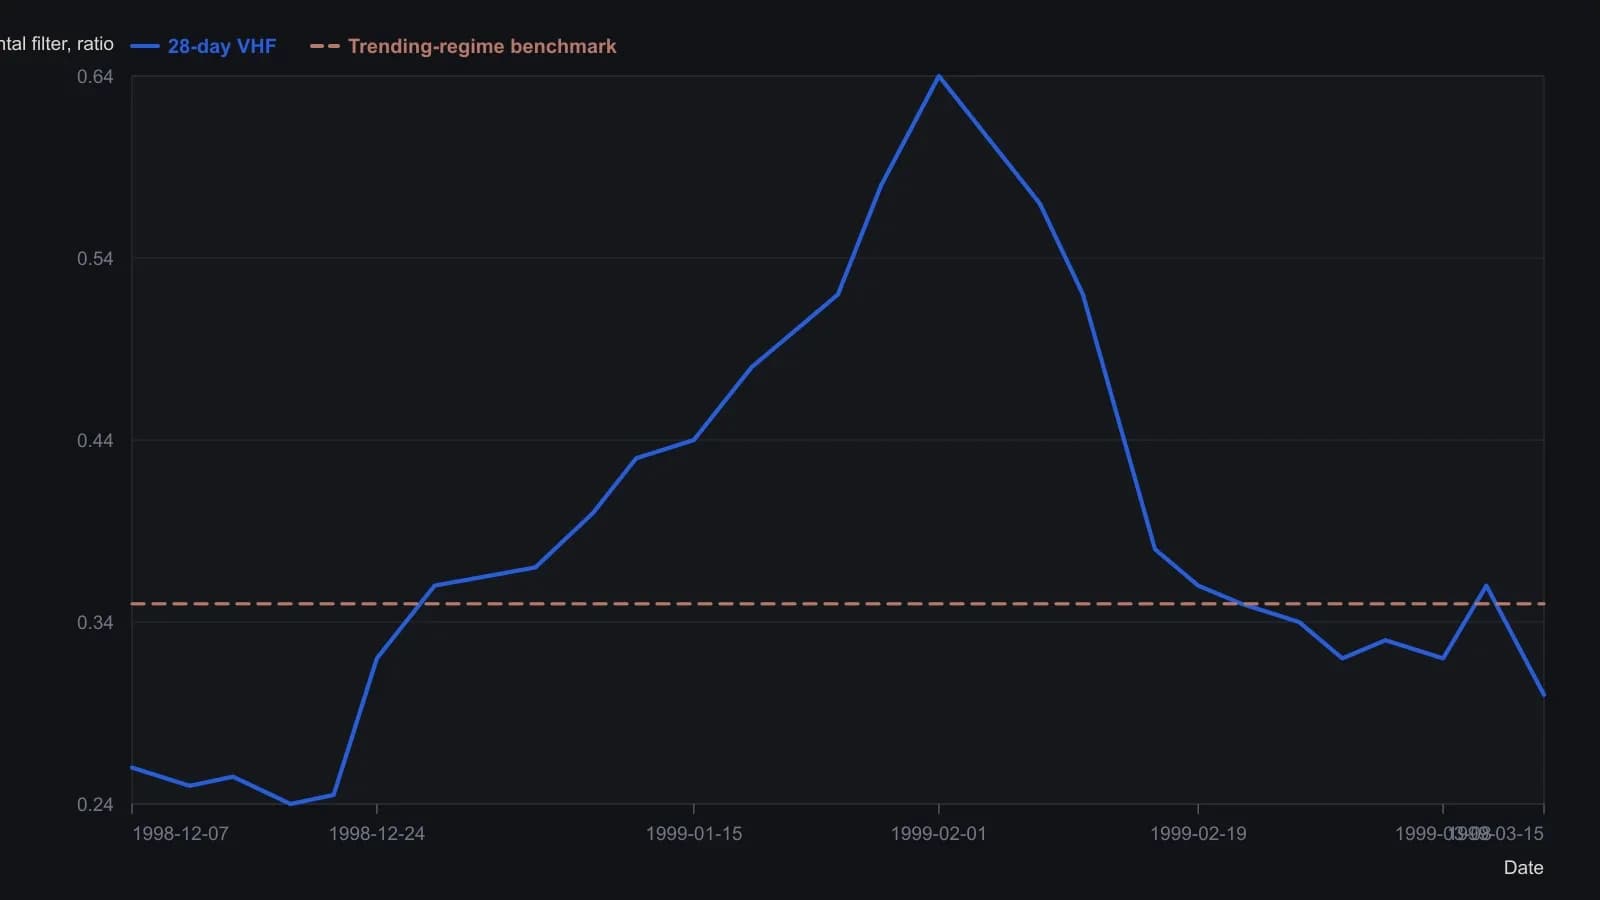
Digitized from the Figure 3 VHF pane (28-day VHF as given in the sidebar). Dates are trading-day labels on the chart axis. Y-values are approximate to about 0.02; the pane last-print of 0.23966 is the right-edge reading and sits slightly below the visible line at mid-March. The 0.35 threshold is the midpoint of the 0.30–0.38 band the article cites, not a Dell-specific fitted cut.
Set a security-specific regime-benchmark
Some constructions treat readings above about 0.3 to 0.38 as a trending regime and readings below that band as congestion. No single benchmark travels well across securities.
An alternative construction uses the filter's own congestion-range high as a breakout threshold. A rise above that local high is read as a shift from range into trend and as a cue to attach a trend-following method.
Either choice is a regime-benchmark: a security-specific level or local high-low band on the filter used to mark the shift from congestion into a trend, or the reverse.
Treat extremes as a second trend-filter cue
Extreme high readings can be read as a contrarian trend-filter cue that a trending phase may be exhausting into congestion. Extreme low readings can be read as a cue that a range may be about to resolve.
Editorial reading of the two-layer sequence
Editorial interpretation: TradersWeek reads the archive workflow as a gating sequence. First build the vertical-horizontal filter and decide whether a trend filter is in force. Then allow a moving-average crossover to fire only inside a trending regime.
A trend filter is a regime overlay that permits or withholds trend-following tactics according to whether measured trend strength is rising, falling, or sitting in a local range. A moving-average crossover is a price-structure signal intended only after a trend regime has already been identified. A congestion-phase, in which the filter stays relatively flat, calls for range tools rather than trend tools.
All readings on this track · 57 readings
- 1988Constructing moving averages: weights, smoothing and crossovers
- 1988Constructing breadth and average trend states
- 1989Evaluating an always-in-the-market moving-average crossover
- 1989Constructing symmetric market-breadth ratio accumulators
- 1989Objective crossover tests of Fibonacci wave ratios
- 1990Volume-adjusted moving average construction
- 1991Constructing a mechanical crossover on a synthetic price series
- 1991A two-speed breadth reading for intermediate market direction
- 1992A Deutschemark yield map with dual-average and relative-strength timing
- 1992Confirming currency-fund trends with a crossover and a filter
- 1992A moving-average slope filter for crossover signals
- 1992Occupancy and split-sample tests for average crossovers
- 1994Gold-mining seasonality and bond-fund duration switching
- 1994Price oscillator from two moving averages
- 1995Explicit exponential weights and binary entry filters
- 1996Currency futures crossover with slope, bond filter, and stop
- 1996Two-market average crossover entry with a fixed stop
- 1997Construction of a filtered three-average crossover
- 1998Two-group exponential average compression as a trend filter
- 1998Constructing r-squared trend filters with dual lookbacks
- 1998Moving-average length is a habit, not a secret
- 1999Solving the close that triggers a moving-average crossover
- 2000Kagi yang and yin control versus crossover noise
- 2000Constructing simple moving average crossover filters
- 2000Building a vertical-horizontal filter to gate trend signals
- 2000Two-average crossover as a check on trend following
- 2003Stacked exponential-average retracement entries and extreme stops
- 2003Evaluating oscillator thresholds against optimized crossovers
- 2004Constructing a semicycle trend-quality filter
- 2004Commodity subgroups labeled by crossover, support, or convergence
- 2004Full-window evaluation of crossover trend systems
- 2004Two-average trend filters as a classroom critique of indicator stacking
- 2005Three-layer confirmation from a moving-average cross, candles, and Q-stick
- 2005Charting put prices beside an equity breakdown
- 2005Range-gated moving-average crossover construction
- 2007Anticipating a simple-average crossover with a threshold-close
- 2007Anticipating moving-average crossovers one bar ahead
- 2007Lead-series moving-average crossovers with a stochastic and relative strength index
- 2007Next-bar SMA crossover hypotheses from theoretical crossing values
- 2007Anticipating a moving-average crossover before confirmation
- 2007A three-horizon moving-average stack as a construction problem
- 2007Confirming trend with regression slope and r-squared
- 2008Constructing a multi-timeframe smoothed crossover
- 2008Best-day clusters versus trend filters
- 2008Allied markets as a confirmation gate for crossover and breakout signals
- 2008Weekly exponential-average crossover as a mechanical trend case study
- 2010Evaluating a 200-day crossover as long, short, and stand-aside rules
- 2010Read a 10-and-40 trend on two neighboring time frames
- 2012Sampling unit as a first-class parameter on dual simple moving averages
- 2012Constructing index-ETF entries from volatility-index persistence
- 2013Moving-average baselines versus crossover signals
- 2013Constructing a typical-price and heikin-ashi crossover as one mechanical procedure
- 2016A three-gate checklist for longs after a sharp drop
- 2016Weekly inflation-ratio crossover for commodity regimes
- 2017Normalized Laguerre zero-axis warning as a two-marker construction
- 2019Range-weighted construction of an adaptive exponential moving average
- 2020Construct a second-pullback entry after a moving-average crossover