1998issue C121-5
Moving-average length is a habit, not a secret
A moving average averages closing prices over a chosen lookback and marks trend, support, resistance, and breakouts. Popular lengths are not shown to be intrinsically more informative than non-round alternatives, so the teaching construction is to fix a length and read repeating price-to-average patterns as a forecast.
- A moving average is a line of averaged closing prices over a chosen lookback and is used as a trend marker and as a reference for support, resistance, and breakouts.
- Popular round lookbacks are not shown to be intrinsically more informative than non-round alternatives, and many averages in a strong uptrend stack as nearly parallel lines.
- The teaching construction is to fix a lookback and learn that market's retracement-to-average behavior around that specific line.
- A moving-average-crossover can be built as crossover-acceleration: two averages flatten, then the shorter line curves through the longer one as price hugs the shorter average.
A moving average is constructed as a line of averaged closing prices over a chosen lookback. That line is used as a trend marker and as a reference for support, resistance, and breakouts.
The construction complaint attached to moving averages is lag. They respond after the trend has already changed, which delays signals.
No privileged lookback
Popular simple-average lengths such as 10, 20, 21, 30, 50, and 200 days are not shown to be intrinsically more informative than non-round alternatives such as 16, 24, 77, or 136.
In a strong uptrend a shorter lookback is expected to sit above a longer one. Plotting many averages from 2 to 200 days therefore stacks nearly parallel lines rather than isolating one privileged length.
Fix a length and study the reactions
The teaching construction is to fix a length, then learn how that market tends to react around that specific average, because repeating price-to-average patterns can be used as a forecast.
The same weekly uptrend can be studied with either a 30-week or a 20-week average. The first observer looks for a retracement-to-average close to the 30-week line, while the second looks for a pullback slightly below the 20-week line.
Steeper uptrends tend to produce shallower pullbacks. An especially steep weekly advance may be expected to stall only about halfway between the 10-week and 30-week averages, while a break below the 30-week line is treated as an unusual warning.
A daily hypothesis around a short average
On a daily chart, a short, volume-backed rise is constructed as a buy hypothesis a few ticks above the 10-day average, with the limit raised as that average advances.
Crossover as a repeatable chart condition
A moving-average-crossover is a chart condition in which a shorter average crosses a longer one and is treated as a repeatable signal setup.
A bullish construction is a flattening pair of 10-day and 30-day averages that then curves with the shorter line above the longer one while early-session lows hug the 10-day average. Rising volume is treated as confirmation of a fast advance. That sequence is crossover-acceleration: the pair flattens, then the shorter average curves through the longer one as price hugs the shorter line.
The inverse construction starts with the 10-day average only slightly above a flat or gently rising 30-day average, then both turn down and the shorter line curves below the longer one while early highs hug the 10-day average. Expanding volume is treated as confirmation of a sharp decline.
Stanford Telecommunications daily close and 200-day average
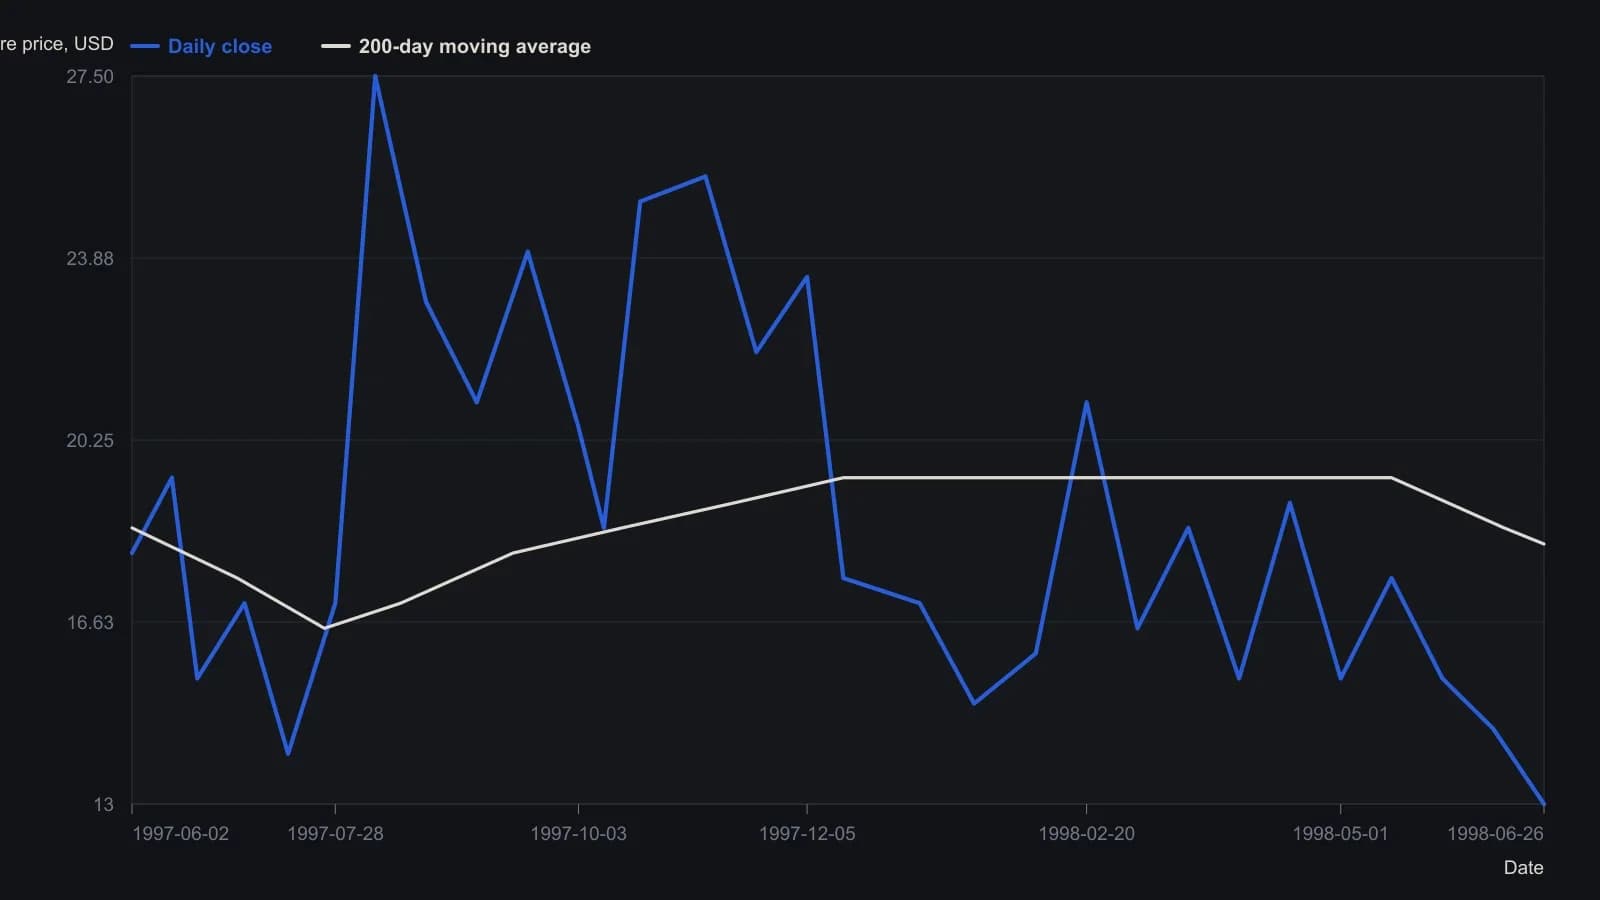
Digitized from the printed SuperCharts daily raster; prices are readable to about half a dollar. The 26 June 1998 close of 13.00 and the 200-day average of 18.179 are the printed quote-bar figures, not curve estimates.
All readings on this track · 57 readings
- 1988Constructing moving averages: weights, smoothing and crossovers
- 1988Constructing breadth and average trend states
- 1989Evaluating an always-in-the-market moving-average crossover
- 1989Constructing symmetric market-breadth ratio accumulators
- 1989Objective crossover tests of Fibonacci wave ratios
- 1990Volume-adjusted moving average construction
- 1991Constructing a mechanical crossover on a synthetic price series
- 1991A two-speed breadth reading for intermediate market direction
- 1992A Deutschemark yield map with dual-average and relative-strength timing
- 1992Confirming currency-fund trends with a crossover and a filter
- 1992A moving-average slope filter for crossover signals
- 1992Occupancy and split-sample tests for average crossovers
- 1994Gold-mining seasonality and bond-fund duration switching
- 1994Price oscillator from two moving averages
- 1995Explicit exponential weights and binary entry filters
- 1996Currency futures crossover with slope, bond filter, and stop
- 1996Two-market average crossover entry with a fixed stop
- 1997Construction of a filtered three-average crossover
- 1998Two-group exponential average compression as a trend filter
- 1998Constructing r-squared trend filters with dual lookbacks
- 1998Moving-average length is a habit, not a secret
- 1999Solving the close that triggers a moving-average crossover
- 2000Kagi yang and yin control versus crossover noise
- 2000Constructing simple moving average crossover filters
- 2000Building a vertical-horizontal filter to gate trend signals
- 2000Two-average crossover as a check on trend following
- 2003Stacked exponential-average retracement entries and extreme stops
- 2003Evaluating oscillator thresholds against optimized crossovers
- 2004Constructing a semicycle trend-quality filter
- 2004Commodity subgroups labeled by crossover, support, or convergence
- 2004Full-window evaluation of crossover trend systems
- 2004Two-average trend filters as a classroom critique of indicator stacking
- 2005Three-layer confirmation from a moving-average cross, candles, and Q-stick
- 2005Charting put prices beside an equity breakdown
- 2005Range-gated moving-average crossover construction
- 2007Anticipating a simple-average crossover with a threshold-close
- 2007Anticipating moving-average crossovers one bar ahead
- 2007Lead-series moving-average crossovers with a stochastic and relative strength index
- 2007Next-bar SMA crossover hypotheses from theoretical crossing values
- 2007Anticipating a moving-average crossover before confirmation
- 2007A three-horizon moving-average stack as a construction problem
- 2007Confirming trend with regression slope and r-squared
- 2008Constructing a multi-timeframe smoothed crossover
- 2008Best-day clusters versus trend filters
- 2008Allied markets as a confirmation gate for crossover and breakout signals
- 2008Weekly exponential-average crossover as a mechanical trend case study
- 2010Evaluating a 200-day crossover as long, short, and stand-aside rules
- 2010Read a 10-and-40 trend on two neighboring time frames
- 2012Sampling unit as a first-class parameter on dual simple moving averages
- 2012Constructing index-ETF entries from volatility-index persistence
- 2013Moving-average baselines versus crossover signals
- 2013Constructing a typical-price and heikin-ashi crossover as one mechanical procedure
- 2016A three-gate checklist for longs after a sharp drop
- 2016Weekly inflation-ratio crossover for commodity regimes
- 2017Normalized Laguerre zero-axis warning as a two-marker construction
- 2019Range-weighted construction of an adaptive exponential moving average
- 2020Construct a second-pullback entry after a moving-average crossover