2004issue C051-5
Rebuild every industry as a share of one rank scoreboard
A published sector ratio inherits weighting noise and can hide leadership inside the group. Ranked relative strength puts every liquid name on one daily scoreboard, converts each industry into a share of that board, and leaves rank-rotation and an MACD overlay to act only on the reconstituted lines.
- A diversified equity market can host several business cycles at once, so one broad index can hide an industry that is not moving with the headline trend.
- Ranked relative strength ranks the full universe on one-day closing change, averages those ranks inside each industry, normalizes the averages so they sum to one, and accumulates each gap from the equal-share baseline.
- Rank-rotation and industry-rotation then read the order, slope, and ten-way share of the reconstituted sector indexes, while MACD only marks turns on those rebuilt lines.
- On the information-technology window the ratio and the ranked series diverged, and the same ranking on a price-level cohort showed a sub-$10 leadership turn that an MACD overlay later confirmed.
One headline trend can hide several cycles
A diversified equity market can host several business cycles at once, so one broad index can hide an industry that is not moving with the headline trend.
Dividing a published sector index by a base index inherits outlier price noise and capitalization or price weighting, so large names can mask small-cap leadership inside the same group. That conventional quotient is a relative-strength ratio.
When names inside one industry do not move tightly together, a capitalization-weighted ratio plot becomes noisy while a ranked rebuild stays cleaner. A sector is any basket assumed to share positive price co-movement, whether an industrial family or a non-industry split such as value versus growth, large versus small capitalization, or a price-level cohort.
Rank the universe, then share it out
Ranked relative strength rebuilds each industry by ranking the full universe on one-day closing change, averaging those ranks inside the group, normalizing the averages so they sum to one, and accumulating each day's gap from an equal-share baseline. The cumulative series is the reconstituted sector index that later rules compare, rotate, and overlay.
The construction uses daily closes on the 1,500 names of the S&P Super Composite, bucketed into ten GICS industries, because liquidity in that universe supports complete, continuous data.
Logarithmic and percentage one-day changes produce the same rank order. With 1,500 names the median sits at the 750th position, and a sector scores above 0.50 when more than half its names beat that median.
If all ten industries had identical returns, each would hold a 0.1 share. Persistent gaps from that equal-share baseline are treated as strength or weakness and graph as a steadily rising or falling cumulative line.
A hyperbolic-tangent map with scaling factor 3 assigns each rank a score from near 0 to near 1, with 0.5 at the median, before the same average, normalize, and accumulate steps.
One-day GICS shares of the rank scoreboard
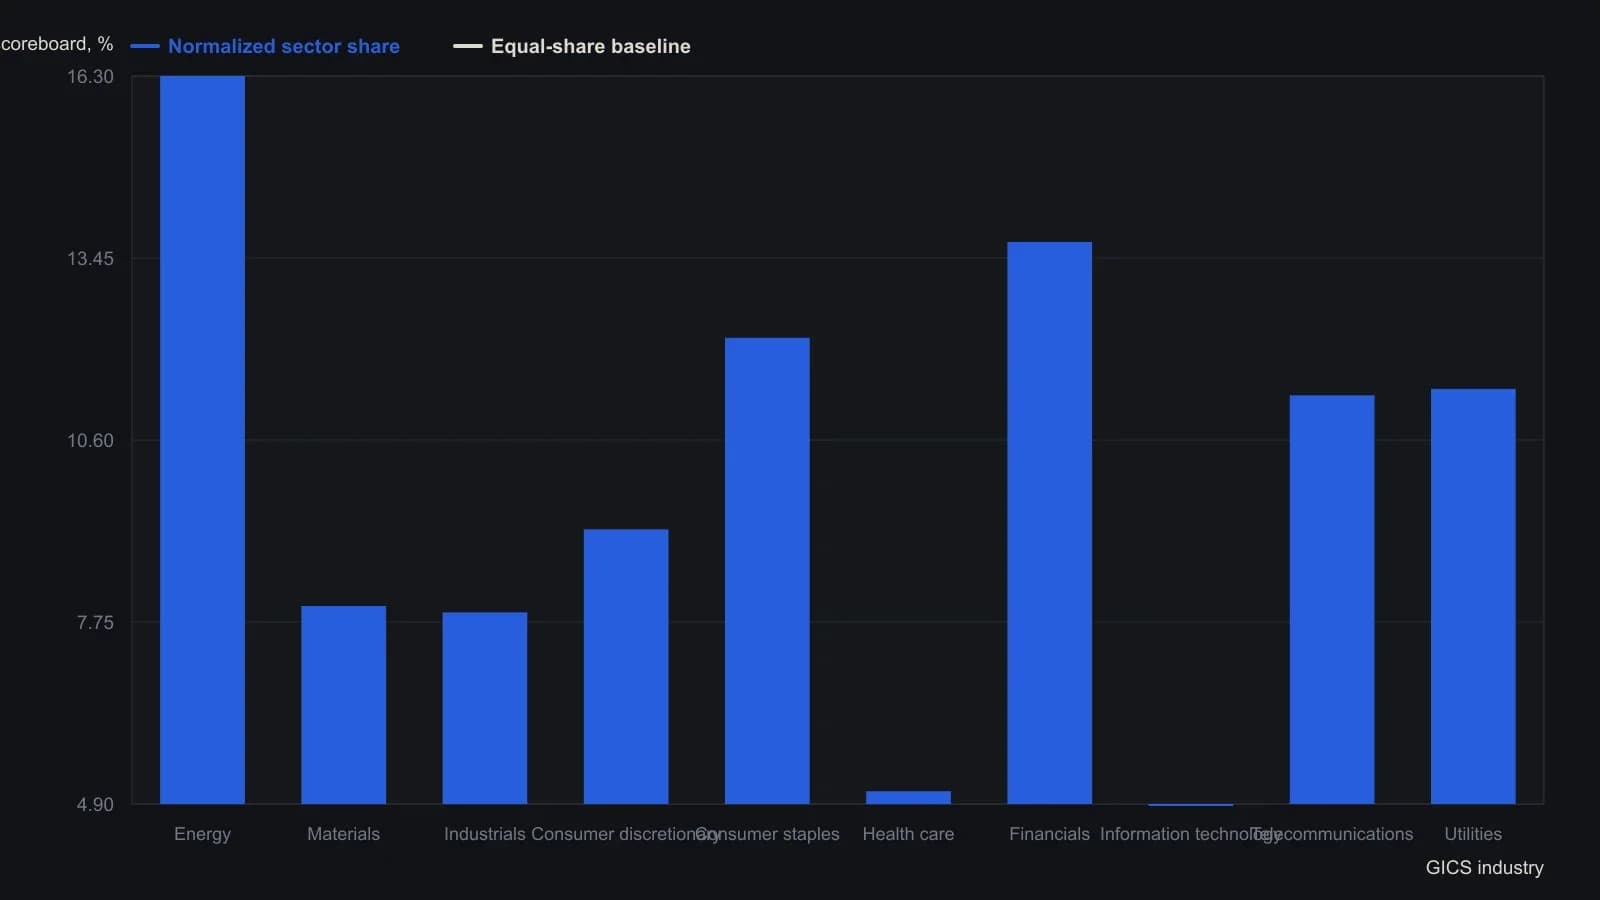
Each name is scored with a hyperbolic tangent of its one-day rate-of-change rank (scaling factor 3) inside the S&P Super Composite 1,500, then the ten GICS averages are rescaled so they sum to 100 percent. This is a single-day worked example, not the reconstituted daily index.
Read order, slope, and the ten-way share
Rank-rotation selects, avoids, or stands aside from industries by the order and slope of their reconstituted rank series rather than by a single broad-market average.
Industry-rotation reads the ten-way share of ranked strength as the market regime that tells a single name whether its group is leading, lagging, or mixed.
When the ratio and the ranks disagree
On the information-technology window, the standard ratio and the ranked series diverged. The ratio did not take out its earlier peak while the ranked series made a higher high, and from mid-April 2003 into early July that industry led the ranked panel.
From that divergence through the next labeled high, nearly 20% of information-technology names sat in the top 10% of the cross-section, ahead of every industry except health care. That is the breadth a rank-rotation rule would have read instead of the ratio's implied downturn.
Apply the same ranking to a price-level cohort
The same ranking applied to two price-level cohorts split by a 200-day average and a $10 cutoff showed a sub-$10 leadership turn in early April.
An MACD overlay on that reconstituted series confirmed the turn by month-end, and the episode lasted into early July. MACD here marks turning points and zero-line crosses on the reconstituted ranked series. It is not a substitute for the ranking construction.
All readings on this track · 23 readings
- 1985Industry leadership carryover as a bull-regime test
- 1988Constructing industry-group breadth and rotation measures
- 1992Trendline holds, trailing stops, and industry rotation
- 1994Inflation-deflation regimes inside the stock cycle
- 1996Sector rotation across economic cycle phases
- 2001Rebased relative performance charts for sector rotation
- 2001Place a small-cap growth idea inside a regime map
- 2004Rebuild every industry as a share of one rank scoreboard
- 2004Rate-hike regimes and sector rotation as a case study
- 2005A two-name style-index sleeve makes rank rotation one procedure
- 2006Consumer staples after a smokestack cycle
- 2007An intra-sector regime split between builders and equity REITs
- 2008Country and sector weights in an Africa regional-sleeve
- 2011Trend permission, priced entries, and sector rotation
- 2012Construct a regime-aware context from sector rotation
- 2012Regime overlays versus rank rotation
- 2014Rank-based sector rotation as a portfolio test
- 2017Real estate as a ranked industry sleeve
- 2017Theme sleeves: liquidity and commission filters before industry rotation
- 2018Retail sleeve construction through channel rotation and daily leverage
- 2020Water sleeve construction: satellite size, industry mix, and liquidity
- 2020A ranked research terminal as a three-layer watchlist procedure
- 2020Regression channels for sector rotation context