1994issue C111-6
Ratio MACD crossover as a portfolio weight filter
A weekly relative-strength ratio, read with MACD and a nine-week trigger line, can decide when a name, sector, or region earns weight versus cash rather than when price alone looks tradable.
- A relative-strength ratio of weekly closes shows outperformance or underperformance versus a broad index, even when prices themselves are falling.
- MACD of that ratio, crossed with a nine-week exponential trigger line, favors holding the security above the trigger and cash or a stronger alternative below it.
- A price moving-average crossover can confirm the ratio signal when a falling market inflates relative strength, and single stocks can require the ratio MACD to sit above zero as well as above the trigger.
- Allocation breadth, the share of monitored names on buy versus sell signals, can set equity, cash, regional, and sector weights.
A relative-strength ratio of weekly closes
A relative-strength ratio is formed by dividing a fund or stock weekly close by a broad-index weekly close. A falling ratio marks underperformance. A rising ratio marks outperformance. The ratio is used to show relative performance rather than absolute price direction.
Editorial note: TradersWeek treats this archive workflow as a portfolio-construction filter. The repeatable relative-performance condition decides when a name, sector, or region earns weight versus cash, not when price alone looks tradable.
MACD and the trigger line on the ratio
Two moving averages of the ratio strip noise. Their difference is the MACD line, treated as a leading read on the ratio trend. A nine-period exponential average of that line is the trigger line for important relative-performance turns. Here MACD is applied to the relative-strength ratio, not to the price chart.
MACD applied to that ratio produces discrete signals when the MACD line crosses its nine-week exponential trigger. A cross above the trigger favors holding the security. A cross below it favors cash or a stronger alternative.
Ultra-to-S&P 500 ratio MACD versus the nine-week trigger
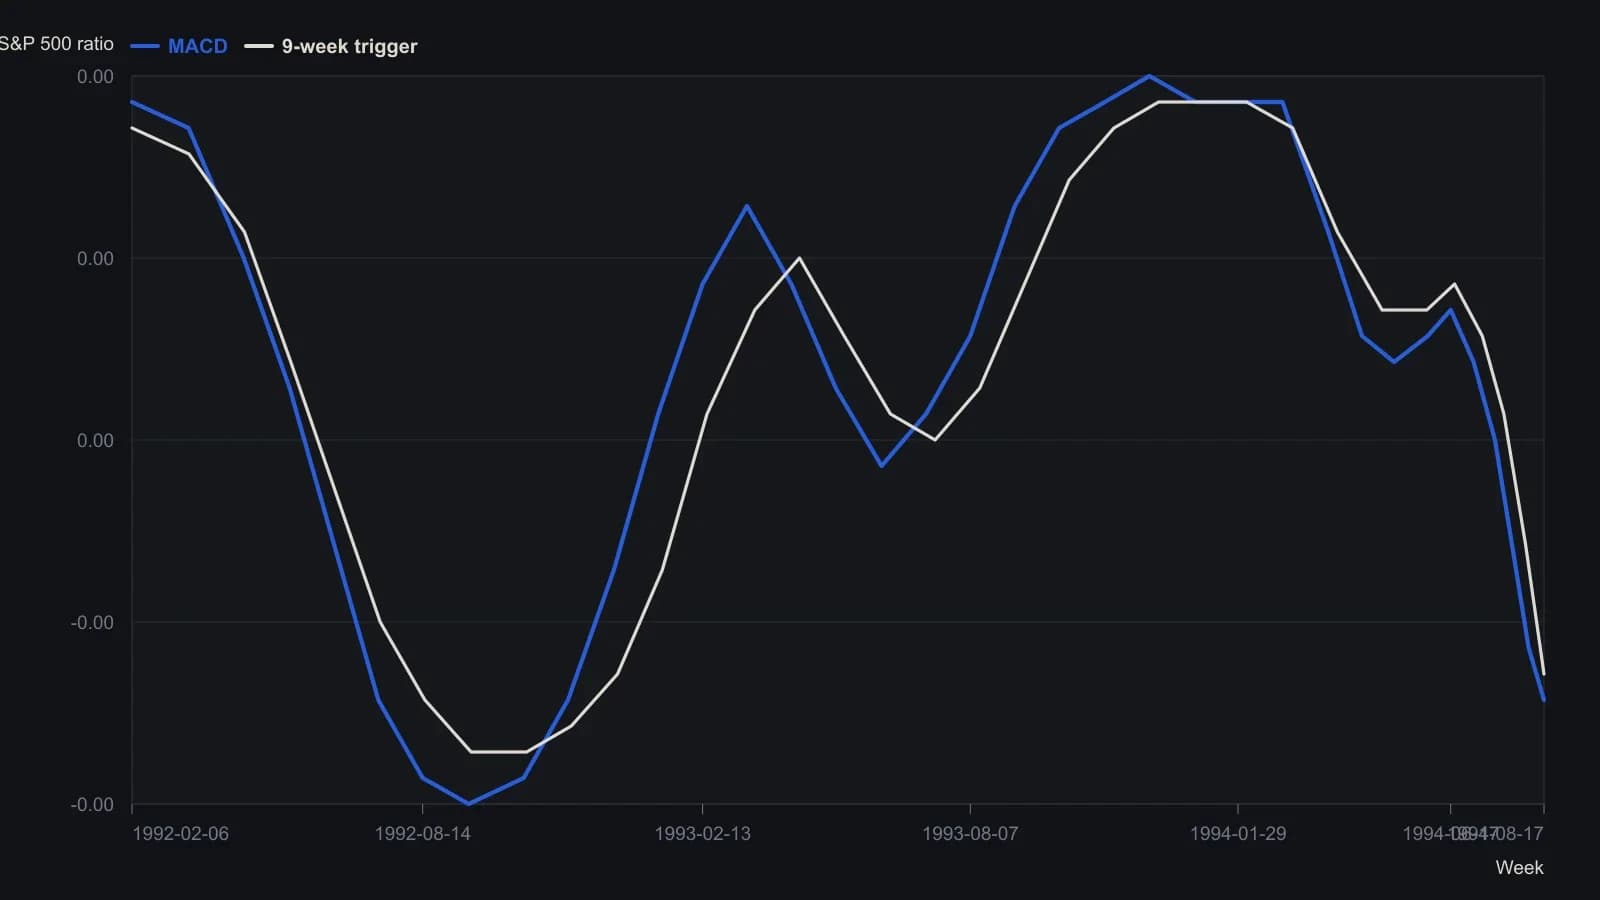
Classic MACD applied to the weekly fund/index close ratio; the trigger is the nine-week EMA of that MACD. Dates and levels are approximate readings from the printed weekly plot, not exact computed prints.
Price confirmation and tighter stock rules
If the broad market falls faster than the holding, the ratio can strengthen even as prices decline. A moving-average crossover on price can then be required as a second confirmation, so a rising relative-strength reading is not taken on its own.
For single stocks, which are treated as more volatile than funds, a long setup can require the weekly stock-to-index MACD to sit both above zero and above its trigger. Requiring the stock-ratio MACD to be in positive territory can delay entries while reducing false signals relative to trigger crosses alone.
Allocation breadth for equity, region, and sector weights
Across a watchlist, allocation breadth is the share of names on sell versus buy signals, and that share can set the equity-versus-cash weight. One illustrated case uses 35 sells among 50 names to justify cutting the equity sleeve to 30 percent.
The same breadth comparison between domestic and foreign names can shift capital toward the sleeve with more buy signals. An illustrated mix uses 70 percent of domestic names on sells and 65 percent of foreign names on buys.
The same ratio-MACD crossover applied to sector indices can flag which sectors are outperforming the broad index. It can be used to select constituents from the stronger sector.
All readings on this track · 26 readings
- 1990Stress-testing a futures sleeve across equity regimes
- 1990Staged sleeves from one equity forecast
- 1990Score a trade after allocation, diversification, and a drawdown limit
- 1993A three-sleeve regime map for equities, rates, and futures
- 1994Late-cycle breadth as an allocation exam
- 1994Ratio MACD crossover as a portfolio weight filter
- 1995Sizing a trend futures sleeve in a 1995 policy shift
- 1996A 1990s case on liquidity cycles, rank rotation, and cross-market sleeves
- 1997Regime-aware allocation versus binary timing
- 1998Hedge-fund sleeves under a hard drawdown limit
- 2010True diversification as portfolio construction
- 2012Regime-gated trend baskets and layered sizing
- 2013Score fund cost drag before the equity-versus-defensive mix
- 2013Cost-first fund mix in portfolio construction
- 2015Cost-first fund construction and the stock-bond mix
- 2016Audit the fund cost-stack, then set the sleeve-mix
- 2016Read fund listings through costs, then allocation, then diversification
- 2017A four-channel own-account book with signal-replacement
- 2017Listed REITs as a standalone portfolio sleeve
- 2017Cost-first stock and bond fund construction
- 2017Cost-first fund mix in a diversified portfolio
- 2018Mutual-fund costs come before returns in portfolio mixes
- 2018Cost gates before a stock-bond fund mix
- 2019Cost-stack and bond-equity mix around a trade
- 2019Evaluate diversification by correlation, not by the mix label
- 2020Cost-first fund sleeves and a stock-bond mix