2004issue C071-5
Evaluating P/E overlays with matched crossovers
Freeze one monthly crossover, run it on price and on trailing ten-year P/E, and judge the overlay by time-in-market, a stand-aside choice, and a drifting regression mean rather than by whether any single ratio looks cheap or expensive.
- The same five-month versus 21-month moving-average-crossover was applied to monthly industrial-average prices and to trailing-ten-year-pe, each producing 22 buys and 21 exits, with the last November 2003 buy left open when the sample ended on 30 January 2004.
- A linear-regression channel through the monthly P/E series placed the fitted mean at 10 in 1920 and at 22 by early 2004, against a sample median of 14.83, so the evaluation tracked a drifting mean rather than one fixed fair-value line.
- Opening a same-size short on each of the 21 overlay exits lost 1159 industrial-average points, so the fundamental-overlay was used to stand aside. Time-in-market fell from 1008 months fully invested to 598 months on the price rule and 530 months on the overlay, with idle cash assumed to earn nothing.
- The 43-trade sample was assigned a 15 percent error-factor, one divided by the square root of the number of trades, which states how thinly the historical comparison is supported.
A matched-input experiment
The archive runs a monthly industrial-average series from 1920 through 30 January 2004 as a matched-input experiment. One five-month versus 21-month simple moving-average-crossover is frozen, then applied first to price and then to trailing-ten-year-pe.
A moving-average-crossover is a long entry when a shorter simple average crosses above a longer one and an exit when it crosses back below, applied on monthly bars so a repeatable chart condition becomes a testable in-or-out rule. The rule is held fixed so the overlay can be judged by a change of input, not by a change of chart recipe.
The same crossover on price
On the monthly industrial-average price series, the five-month versus 21-month simple moving-average-crossover produced 22 buys and 21 exits. The last buy was dated November and was closed only because the test ended.
The same crossover on trailing ten-year P/E
The fundamental-overlay is a regime filter that replaces the price series with trailing multi-year P/E so the same crossover decides when a long-only book is exposed rather than when a single ratio threshold is crossed. Trailing-ten-year-pe is index price divided by average earnings over the prior ten years, sampled monthly as the overlay input.
The same five-month and 21-month crossover applied to those trailing 10-year index P/E values again produced 22 buys and 21 exits. The November 2003 buy was left open when the sample stopped.
A drifting mean against the sample median
Linear-regression, in this archive workflow, is a fitted trend and channel through ordered monthly valuation observations, used to track a drifting mean against a sample median instead of treating one historical average as a fixed fair-value line.
A linear-regression channel on that monthly P/E series placed the fitted mean at 10 in 1920 and at 22 by early 2004. The historical median P/E in the same window was 14.83.
Extreme P/E readings in the charted history were followed by at least two decades of lower valuations, and prior cycles declined below 10 before a new long advance began.
Trailing ten-year S&P 500 P/E versus median and drifting mean
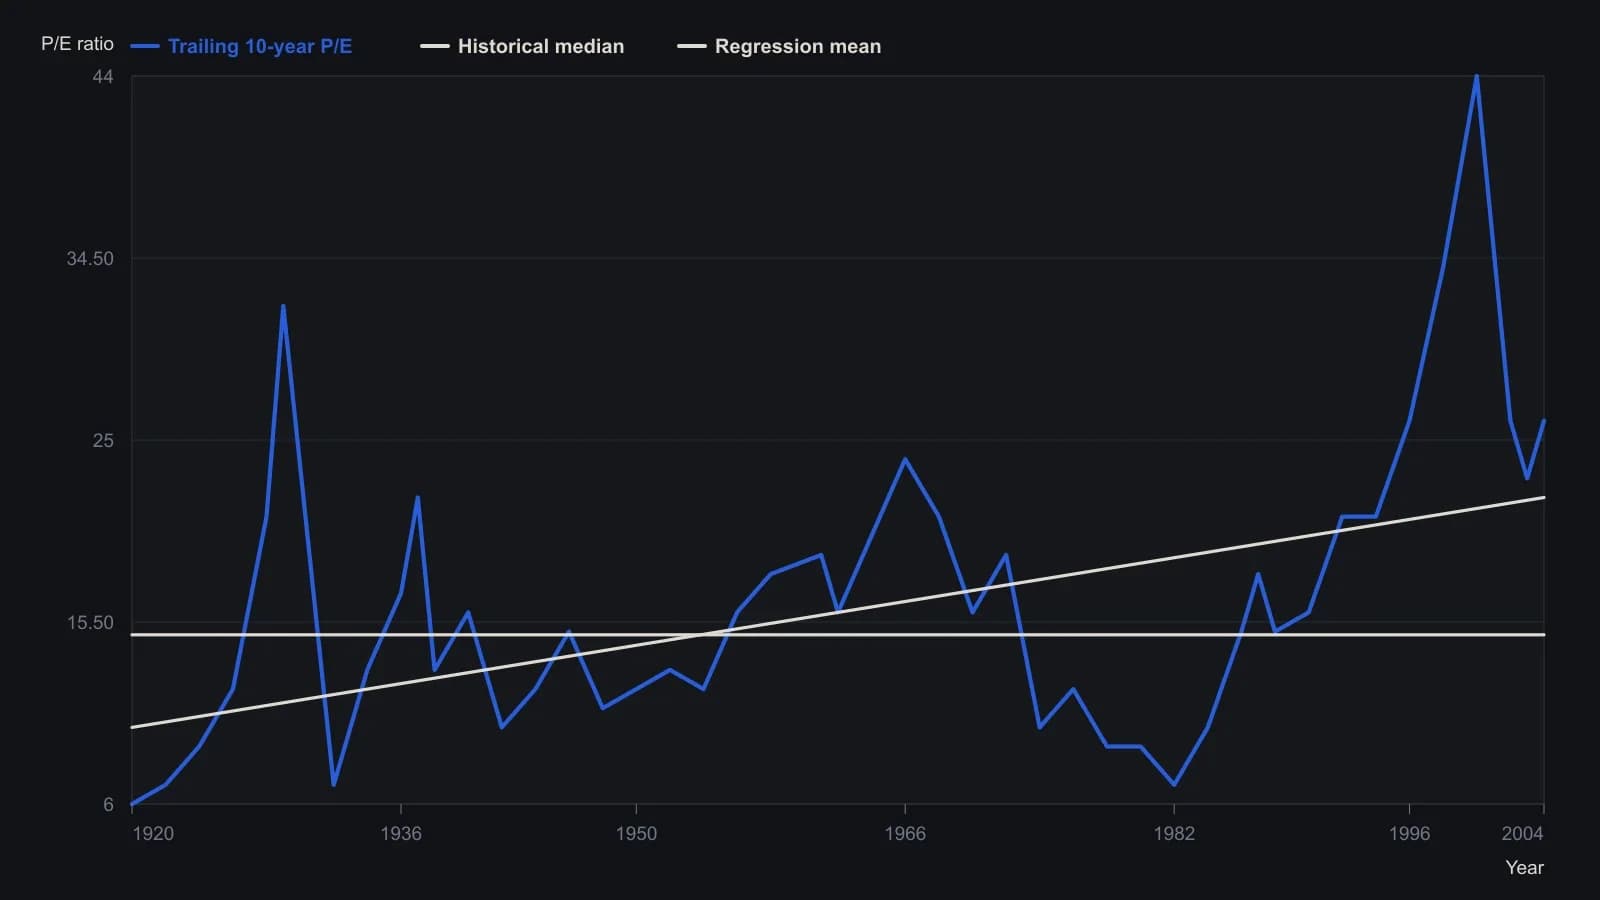
The source applied the same five- and 21-month SMA crossover used on the Dow, producing 22 signals; the November 2003 buy was still open at the January 2004 cutoff. Point heights are approximate readings from the magazine raster.
Stand aside rather than short
Opening a same-size short on each of the 21 overlay exits lost 1159 industrial-average points in total, or 55 points per trade on average. The overlay was used to stand aside rather than to sell short.
Time-in-market when cash earns nothing
Time-in-market is the months or years a rule keeps a long position open, used as the evaluation lens when idle cash is assumed to earn nothing.
Fully invested buy-and-hold spanned 84 years or 1008 months. The price crossover was invested 49.8 years or 598 months. The P/E overlay was invested 44.2 years or 530 months. Idle cash was assumed to earn nothing.
A 1996 to 2003 survey on whether equities are the best holding for investors who simply remain invested through swings showed 96 percent agreement in 1999 and 83 percent agreement in 2003.
How thinly the comparison is supported
The 43-trade sample was assigned a 15 percent error-factor, defined as one divided by the square root of the number of trades. Error-factor is used to state how thinly a historical comparison is supported.
What the overlay is being asked to show
Editorial reading: the archive does not ask whether a printed P/E is cheap. It asks whether the same monthly in-or-out rule, moved from price onto trailing-ten-year-pe, changes exposure time, whether exits are left as cash rather than flipped to shorts, and whether the fitted mean of the ratio has drifted away from the sample median. The 15 percent error-factor belongs inside that judgment, not after it.
All readings on this track · 21 readings
- 1991Growth earnings and price-to-earnings as a market-regime overlay
- 1991Earnings-price reliability as a first gate for growth-sleeve construction
- 1991Growth-adjusted earnings years as construction filters
- 1992Constructing an index nominal from smoothed earnings and effective rates
- 1992Real bond yields as a deficit-share regime
- 1994Relative valuation as regime context for fund allocation
- 1995A flattening trendline as a critique of the fundamental overlay
- 1998An earnings-to-price mapping is unfinished until add, reduce, and stand-aside are rules
- 1999Regime-aware stock exposure when rates and market condition agree
- 2002Short-rate velocity regimes before tightening
- 2003A pre-trade checklist that requires rule and fundamental agreement
- 2004Evaluating P/E overlays with matched crossovers
- 2004Constructing a stock-versus-bond regime from earnings yields
- 2012Cash-rich relative strength as a pre-trade portfolio filter
- 2012Inactivity as a feature: a small-cap earnings overlay with a monthly average and weekly MACD
- 2015Evaluating a capitalization-to-output-ratio as a regime overlay
- 2016Risk-adjusted earnings yield as a portfolio overlay
- 2017Oil, yields, and implied volatility as a regime critique
- 2017When a one-year bull sits inside a secular bear
- 2018A critique of rules-only trading systems
- 2019When seasonal and policy regimes override crowd mood