2014issue C0943-50
A ranking workflow that treated sector rotation as an abstention procedure
A laboratory ranking screen built a hypothetical tactical equity model only after an S&P 500 index-condition check, then used rating history, sector bars, and overbought rules to decide which names to hold, exit, or skip.
- The hypothetical tactical equity model was built from a two-name-per-sector ranking screen only after an index-condition check on the S&P 500.
- The ranking interface showed price change, a rating value, one-day change, a countertrend rank, a platform rating, and alerts, and a clicked rating opened 26-day or six-month history used to judge trending, overbought, or oversold conditions.
- Documented sell logic exited names that broke out or were already overbought, and skipped entries that were approaching or already in an overbought state.
- A sector-rotation pane and a simulate control kept sector strength, the two names assigned to each sector, and a hypothetical equity curve against the S&P 500 in one workflow.
What the laboratory workflow assembled
The archive records a two-name-per-sector ranking screen that built a hypothetical tactical equity model only after an index-condition check on the S&P 500. The index-condition check sat in front of the ranking screen, so the hypothetical model was not assembled from sector ranks alone.
What the ranking interface showed
The same ranking interface displayed price change, a rating value, one-day change, a countertrend rank, a platform rating, and alerts for each symbol. Clicking a rating value opened a 26-day or six-month rating history used to judge whether the current reading was trending, overbought, or oversold.
Exit rules and skipped entries
The documented sell logic was to exit when a name broke out or was already overbought, and to avoid entries that were approaching or already in an overbought state.
Weekly AMZN GET stochastic versus the 75 and 25 triggers
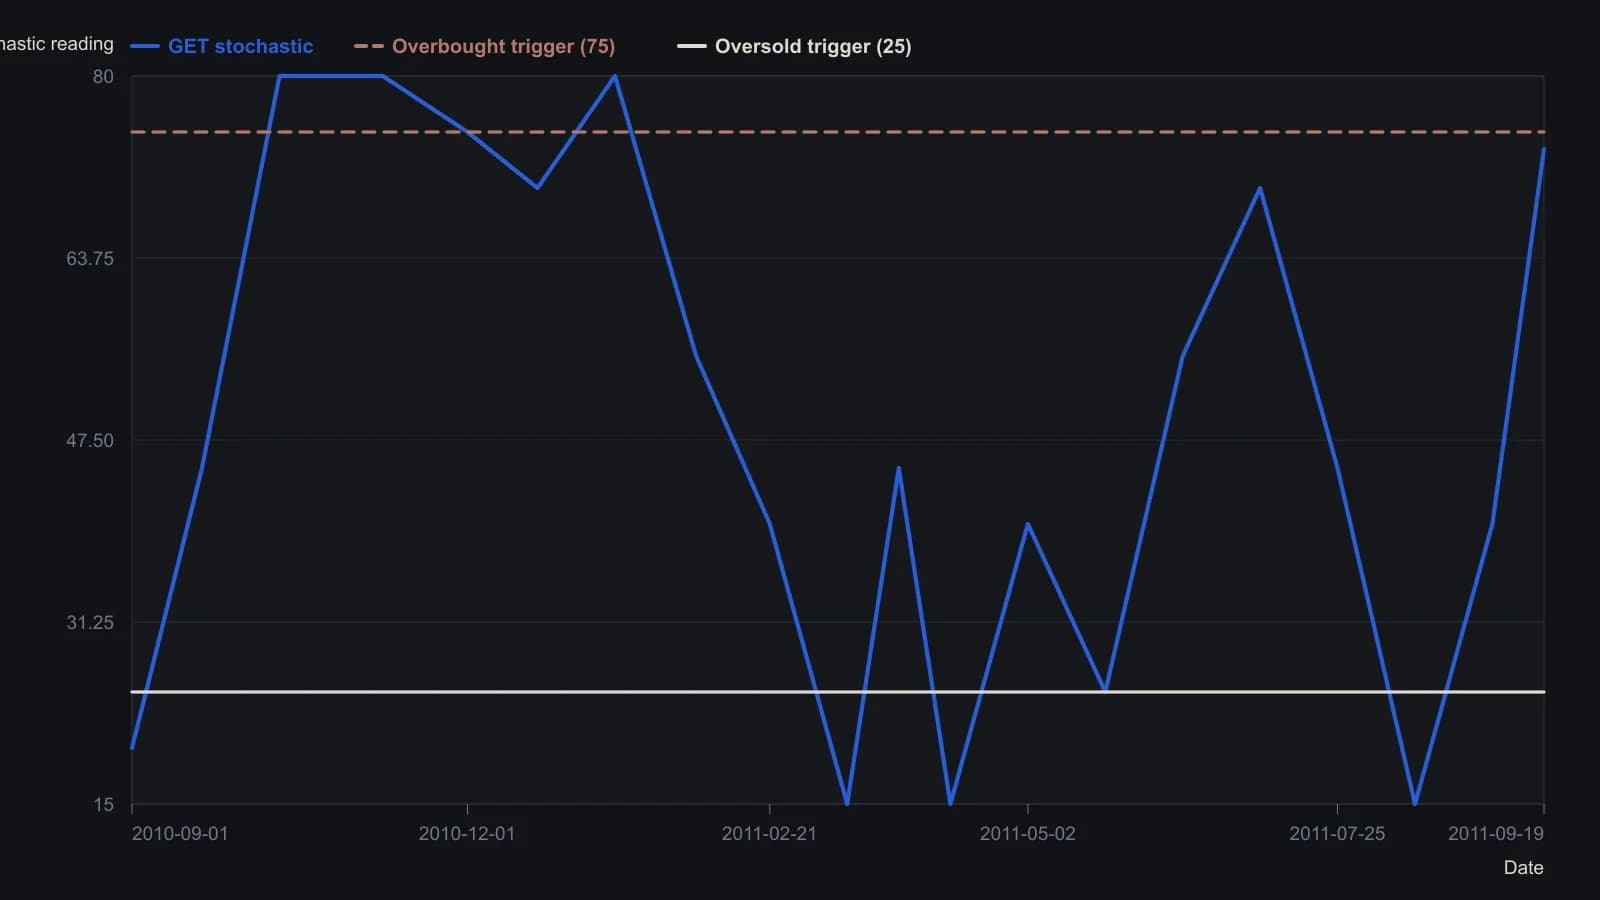
The oscillator pane is a small subplot, so readings other than the labeled 73.47 last print are rounded to the nearest five points. Horizontal 75 and 25 lines are the review’s stated overbought and oversold triggers, not extra digitized curves. Weekly bars run from September 2010 through September 2011.
Sector bars and the simulate control
A sector-rotation pane represented each sector as a bar versus the prior day and listed the strongest and weakest weekly and monthly sectors. Selecting a sector bar opened charts, commentary, ratings, and constituent-stock detail so strength could be inspected across stocks, funds, and sectors in one place.
A simulate control produced a hypothetical equity curve for the model portfolio against the S&P 500, with a details tab listing the two stocks assigned to each sector.
All readings on this track · 10 readings
- 2001Constructing relative-strength ratios for spreads and rotation
- 2001Sector rotation, timing and leverage as a regime case study
- 2004Read one stock idea as a late-cycle puzzle
- 2004Always-on delayed-weak and live-strong sector sleeves
- 2012Building a sector-rotation histogram from rate-of-change spreads
- 2012Constructing a bull-bear sector rotation overlay
- 2012A relative-performance heatmap for pairs trading and sector rotation
- 2014Evaluating an annual contrarian sector rank-rotation
- 2014A ranking workflow that treated sector rotation as an abstention procedure
- 2015A nine-sector sleeve drill on the business-cycle map