2003issue C021-3
Regression slope with an r-squared trend confidence gate
Linear-regression-slope estimates how much a price series is expected to change per sampling interval and whether that fitted trend is positive or negative. The reading stays incomplete until a period-matched r-squared clears its 95% critical-r-squared and is still rising, so oscillator extremes are read only after the fitted line has been admitted as a significant trend.
- Linear-regression-slope estimates how much a price series is expected to change per sampling interval and encodes whether the fitted trend is positive or negative, but it does not by itself measure how strong that trend is.
- R-squared must share the same lookback and price field as slope so both outputs describe one fitted line. A high r-squared plus a large positive or negative slope is treated as stronger evidence that a trend is developing.
- If r-squared is below the matching critical-r-squared at the stated 95% confidence level, the series is treated as showing no statistically significant trend.
- A screen can require slope above zero, r-squared above the period critical value, and a rising-fit-filter. Oscillators that use overbought or oversold levels are described as needing that strength check because those extremes can persist in a strong trend.
Slope as a signed rate of change
Linear-regression-slope is the signed rate of change from a fitted line over a chosen lookback. It is read as how fast the series is expected to move per sampling interval. A steep slope describes a faster rate of change than a shallow slope.
Slope encodes whether the fitted trend is positive or negative. It does not, by itself, measure how strong that trend is.
R-squared as a strength score
R-squared is the goodness-of-fit of that same line. It is used here as a numeric score of trend strength rather than as a standalone buy or sell flag.
R-squared is read with slope. A high r-squared plus a large positive or negative slope is treated as stronger evidence that a trend is developing.
Keep slope and r-squared on one fitted line
Slope requires a lookback and a price field such as close or a high-low average. R-squared must use that same lookback so both outputs describe one fitted line.
That period-matched-pair keeps the strength score on the identical fitted line.
Critical r-squared at 95%
At a stated 95% confidence level, critical-r-squared falls as the lookback lengthens: 0.77 at 5 periods, 0.40 at 10, 0.27 at 14, 0.20 at 20, 0.16 at 25, 0.13 at 30, 0.08 at 50, 0.06 at 60, and 0.03 at 120.
If r-squared for a given lookback is below the matching critical value, the series is treated as showing no statistically significant trend at that 95% threshold.
Critical-r-squared scales inversely with period length. A 10-period threshold of 0.40 implies 0.08 at 50 periods, with other lengths rounded to two decimal places from the same ratio.
A rising-fit screen
A screen can keep only series whose slope is above zero, whose r-squared exceeds the period’s critical value (0.27 at 14 periods or 0.13 at 30), and whose r-squared is higher than on the prior bar.
The rising-fit-filter requires current r-squared to exceed its prior bar so the fit is strengthening, not rolling over.
Fourteen-day r-squared for names that cleared the 95% gate
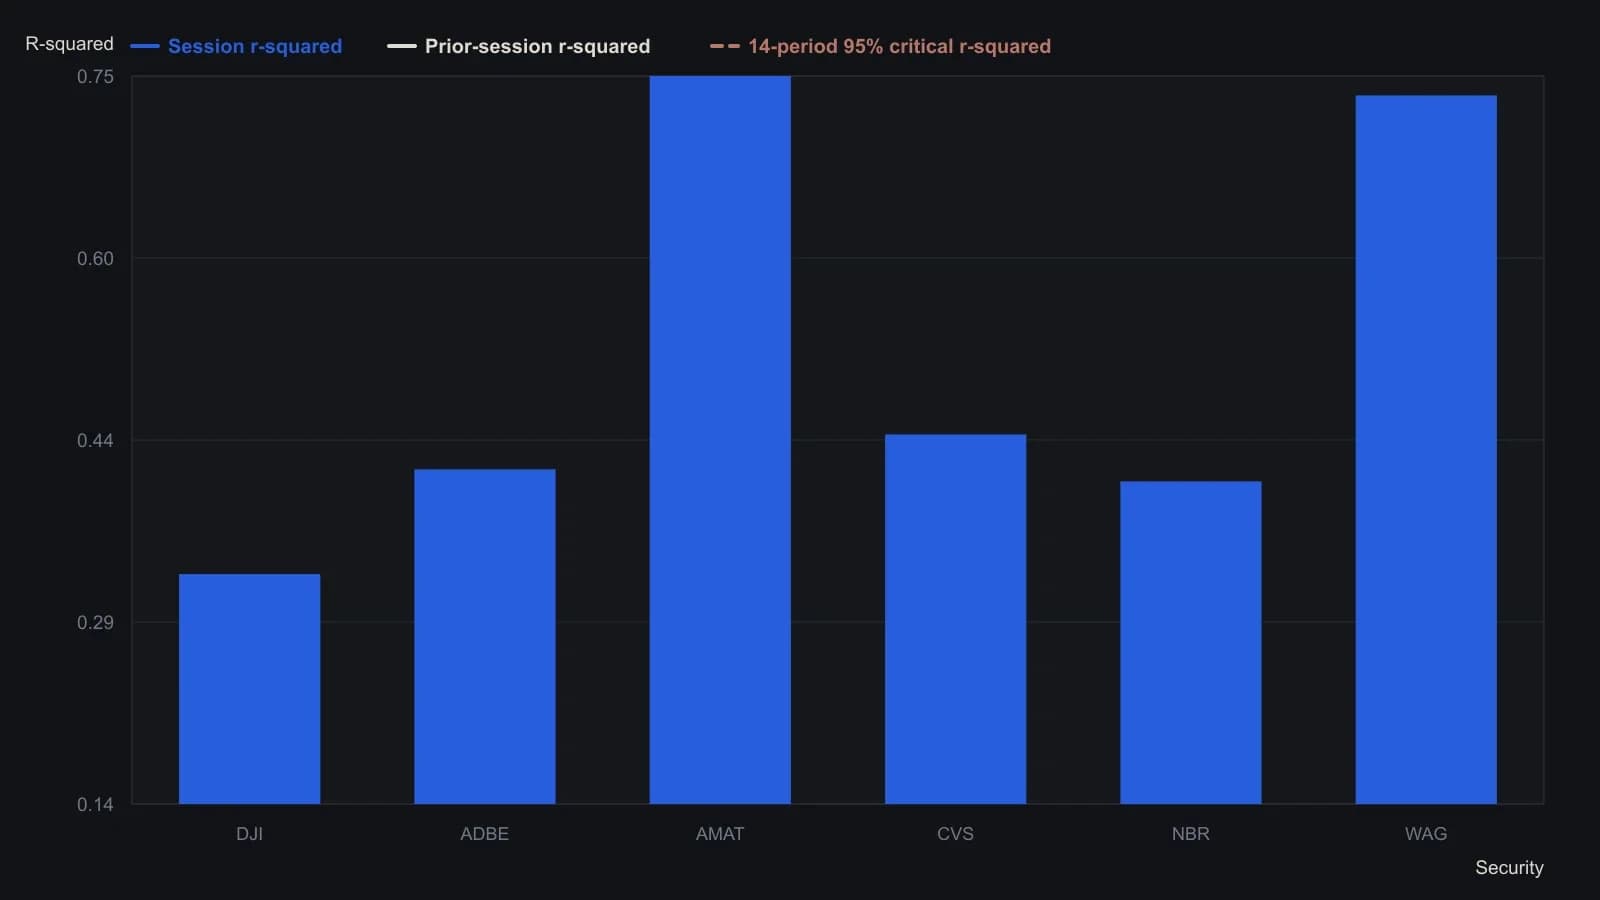
Lookback on slope and r-squared is 14 sessions, the period the source pairs with a 0.27 critical value. The exploration ran on closing prices; six names remained from a 37-name list.
Oscillator extremes after the gate
Oscillators that depend on overbought or oversold levels are described as needing this strength check. A high and rising r-squared is treated as 95% confidence that a strong trend is present and those extremes can persist.
Late fits and false crossings
An unusually high r-squared such as 0.8 is flagged as a possible late or stretched condition. Threshold crossings are acknowledged to include false signals.
Editorial reading
TradersWeek editorial interpretation: treat linear-regression-slope as a signed rate-of-change estimate that stays incomplete until the period-matched-pair r-squared clears its critical-r-squared and still passes the rising-fit-filter. Oscillator extremes are then read only after the fitted line itself has been admitted as a significant trend.
All readings on this track · 43 readings
- 1990Constructing dollar baselines from rates, inflation, and residuals
- 1990Constructing a nominal index value from forward earnings and fitted yield
- 1990Constructing a nominal index price from earnings and a fitted yield
- 1990Endpoint-pinned price paths are not forecasts
- 1990Constructing least-squares polynomial smoothers
- 1991Endpoint growth rates versus linear-regression consistency
- 1991Out-of-sample checks for linear growth fits
- 1991Trend as persistence, not a straight line
- 1991Quadratic trend, residual oscillator, and a secondary cycle calendar
- 1991Time-origin offset and residual-price divergence on a quadratic least-squares fit
- 1991A least-squares trendline from ordered prices
- 1992Constructing log-linear growth and reliability screens
- 1992Constructing log-linear growth-rate baselines
- 1992Next-session high, low, and close from rolling linear regression
- 1993Auditing an index price-earnings multiple with short-rate regression
- 1994Regression-seeded nested exponential price filter
- 1994Constructing the double exponential average from lag cancellation
- 1994Evaluating money supply as a linear leading-index baseline
- 1995Constructing least-squares trend channels
- 1995Linear baseline holdout checks for annual bill-rate forecasts
- 1995Projection bands from high and low regression slopes
- 1995Evaluating a least-squares end-point moving average on a known test series
- 1996Constructing an endpoint moving average from a least-squares line
- 1996Scoring equity path consistency with a k-ratio overlay
- 1996Evaluating month-end yield gaps for equity regimes
- 1996Constructing session-indexed standard error bands
- 1998Evaluating linear regression baselines for index valuation
- 1998R-squared as a two-state trend filter from a price-time fit
- 2000Second-order moving-average lag correction
- 2002Price regression line versus beta for index tracking
- 2003Regression slope with an r-squared trend confidence gate
- 2003Constructing finite-volume-element divergence with slope comparison
- 2004Building a daily score from regression, retracement, and volume
- 2004Constructing least-squares trendlines from ordered prices
- 2007Rectangle breakout targets beyond height
- 2007Confirming a price trend with regression slope and r-squared
- 2008A linear-regression angle assembled as one trend filter
- 2010A two-state swing machine from four running extremes
- 2016Score oil-complex tightness before divergence or regression
- 2017Nikkei-yen intermarket divergence as a regime case study
- 2017Constructing Calmar ratio and linear regression baselines
- 2019Pair-trade layer construction versus average-spread management
- 2020A convolution slope built from nested linear regression