1989issue C071-6
A precious-metal price as a changing intermarket equation
Stepwise multiple linear regression estimated gold, platinum, and silver from inflation gauges and foreign-exchange rates over stated 1975-1989 samples. The coefficient of determination, the unexplained residual, and the gold-platinum ratio then showed how tightly each metal still tracked those intermarket inputs.
- Stepwise multiple linear regression estimated a metal’s mean price from related series such as inflation gauges and, when they still helped, foreign-exchange rates.
- For 1975-1989, consumer and producer price indices associated about 77% of gold-price variation; adding exchange rates raised that share to 85% and left a 15% unexplained residual.
- In the June 1982-January 1989 platinum sample, stepwise selection discarded both inflation indices and attributed 76% of price variance to exchange-rate changes.
- From January 1975 the gold-platinum ratio averaged near 0.92 and later appeared to settle below 0.8, while silver showed the weakest inflation-and-currency linkage of the three metals.
Estimate the metal from inflation and currency first
Intermarket analysis here means reading one metal against inflation gauges and foreign-exchange rates rather than against its own price history alone. The working tool is linear regression: a fitted linear equation that maps ordered inflation, currency, or related observations into an estimated metal price over a stated sample.
Correlation analysis then measures how tightly the metal’s path tracks those inflation and currency inputs across a defined lookback. The archive workflow used stepwise multiple linear regression to estimate a metal’s mean price from related series such as inflation gauges. Stepwise selection keeps only the intermarket variables that help explain the dependent metal price and can drop the rest.
What the gold samples associated with those inputs
For 1975-1989, consumer and producer price indices together produced a coefficient of determination of 0.7664, or about 77% of gold-price variation. The coefficient of determination is the share of price variation associated with the fitted intermarket equation over a stated sample.
Adding foreign-exchange rates associated 85% of gold-price variation with the three intermarket inputs and left 15% to other influences. That leftover share is the unexplained residual: the portion of price variation left after the selected inflation and currency variables are accounted for. Over June 1982-January 1989 the same gold specification explained 72% of price change, leaving a 28% residual.
Gold monthly average versus inflation-and-FX regression, 1975–1988
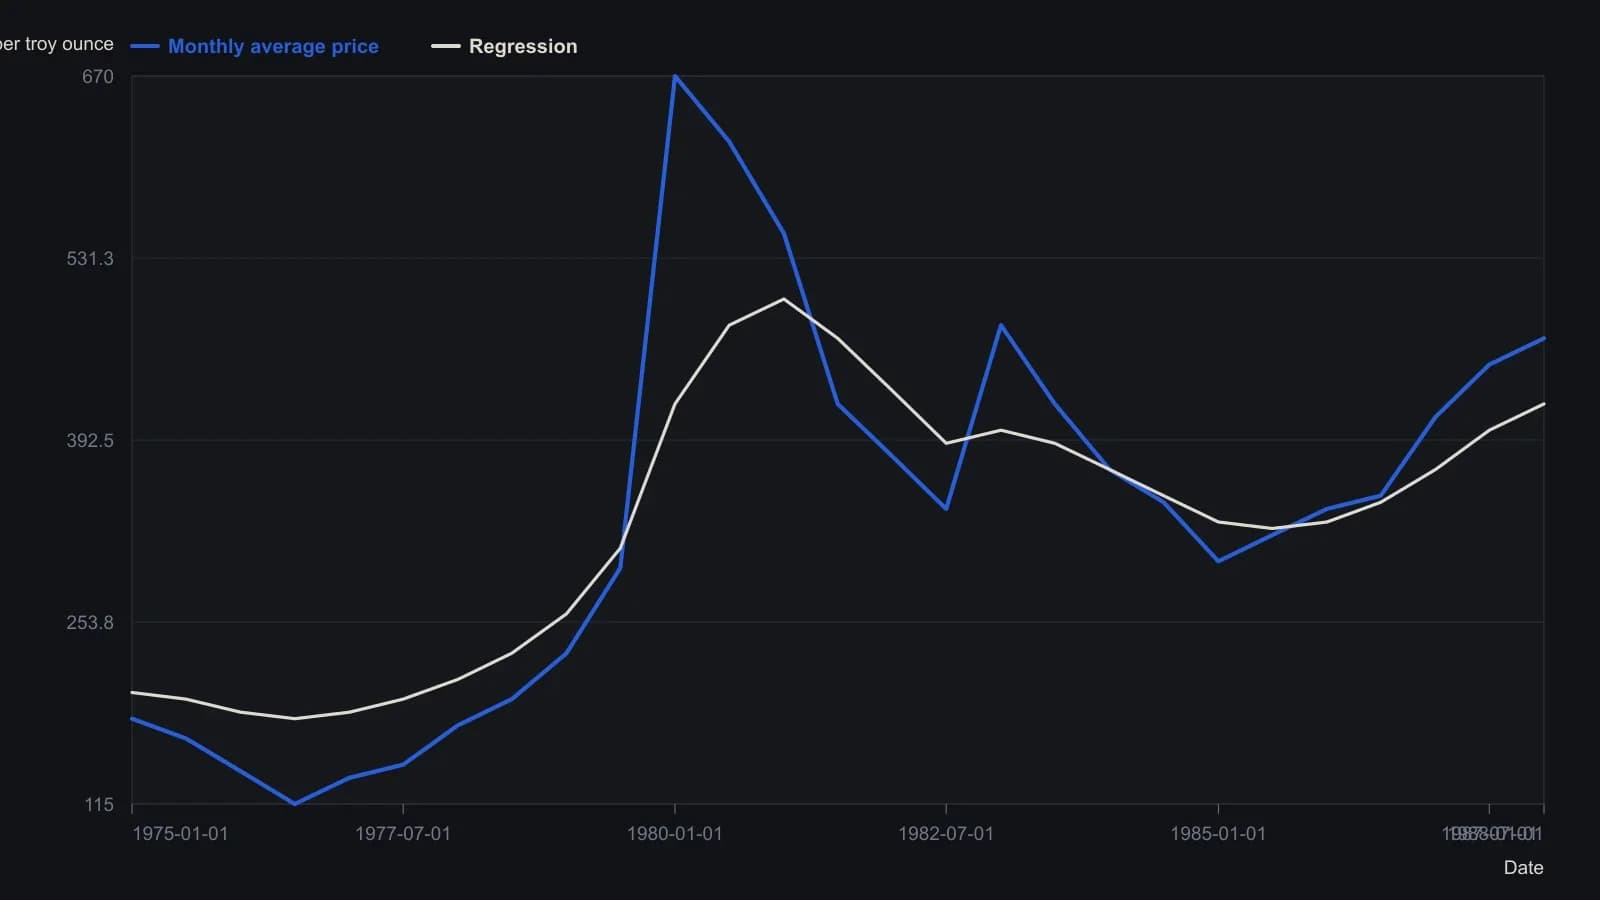
Y values are approximate readings from a ratio-scale raster; the source quotes R² = 0.85 once foreign-exchange rates join CPI and PPI, and 0.7664 for the two inflation gauges alone. Sample in the article runs through January 1989; the printed x-axis ticks end at 88-1-1.
When platinum dropped the inflation gauges
Platinum from January 1975 to January 1989 had about 80% of price variance associated with domestic inflation and exchange rates. In the June 1982-January 1989 platinum sample, stepwise selection discarded both inflation indices and attributed 76% of price variance to exchange-rate changes, alongside import dependence above 99%.
Silver and the gold-platinum ratio
Silver’s inflation-and-FX regressions explained about 57% of variance from January 1975 to January 1989 and about 66% from June 1982 to January 1989, the weakest linkage of the three metals.
From January 1975 the gold-to-platinum price ratio averaged near 0.92 and later appeared to settle below 0.8. The gold-platinum ratio is the relative price of gold versus platinum, used as a spread-style marker of whether the pair still occupies its usual range.
How the historical analysis used the equations
The historical analysis treated the fitted equations as a way to flag unusually high or low metal values, while noting that the type and weight of explanatory factors change over time.
All readings on this track · 37 readings
- 1988Constructing a lead-aware correlation coefficient
- 1989A precious-metal price as a changing intermarket equation
- 1990Two clocks for copper: a factor regime, a regression baseline, and leftover moving-average timing
- 1990Earnings yield, rate correlation and regression for equity value
- 1991Name the window, then combine leaders
- 1991Constructing a two-market linear correlation check
- 1991Constructing a commodity-bond correlation regime filter
- 1992Building intermarket context with linear correlation
- 1993Inverse-scale overlays as a gold-equity regime filter
- 1994Constructing seasonal slots from windows, analog years, and implied volatility
- 1995Pin one reference close and roll companion correlations as an overlay
- 1995Rolling correlation windows for shifting intermarket regimes
- 1998Gold as a cross-market regime barometer
- 1999The gold-bond inverse is a regime, not a cause
- 1999A nested lag test of gold leading bond yields
- 1999Constructing spreads from stock and intermarket correlation
- 2000Evaluating headline versus food-and-energy-excluded CPI as bond-yield context
- 2005A late EUR/USD fifth wave tested by the Bund-Treasury gap
- 2006Intermarket dislocation as context for short-horizon momentum
- 2008Map ordinary 12-month outcomes before stacking valuation, rates, and seasonality
- 2008A clean-energy theme inside the oil-and-energy regime
- 2014Quantitative-easing overlays as fragile belief regimes
- 2015Three intermarket checks from the late-2014 crude decline
- 2015Basket construction via rank, correlation, and locked rules
- 2015Construct a CAD-oil pair from percent-of-range Bollinger maps
- 2015CAD/USD and crude: first the correlation, then the band gap
- 2017Correlation regime versus moving-average crossover for S&P 500 exposure
- 2017Updating intermarket systems after correlation shifts
- 2017Constructing a correlation-divergence regime filter for yen and Nikkei context
- 2018Clustered negative troughs in an energy-index pairwise correlation
- 2018Filter pairwise-correlation before reading an intermarket regime
- 2018Moving-average supports in the March 2018 correlation shock
- 2020Bond spreads as an equity regime lens
- 2020Crash-protection folklore as a correlation regime question
- 2020Constructing a bounded correlation-trend-filter
- 2020Constructing a correlation-to-line trend filter
- 2020Bitcoin correlation regimes across equities and gold