2000issue C011-4
Second-order moving-average lag correction
A first-order moving average reports only the local level of a fixed lookback, so it stays a half-unit behind a unit ramp. A second-order two-sum construction adds a recency-weighted slope term so the same window can recover the current price once it is full.
- A simple moving average uses only one total of the lookback prices, so it can report the local level but cannot estimate the slope of the same window.
- A two-period average of a unit ramp from 1 to 10 and back to 1 stays a half-unit behind on every bar, so a first-order smoother never catches a constant rise or fall.
- Adding a recency-weighted sum S and forming the estimate as the simple average plus 6S divided by N times N plus one recovers the current price with zero tabulated error on two-, three-, and four-period windows once those windows are full.
- Because the corrected average responds faster, crossover-style decision rules that assume simple-average delay need to be rechecked rather than transplanted unchanged.
Why a simple average stays behind
A moving average is a first-order smoother that averages a fixed lookback of ordered prices and therefore reports only the local level, leaving a systematic lag when the series is trending. Because a simple average uses only one total of the lookback prices, it can represent the local level but cannot estimate the slope of the same window.
A simple two-period average of a unit ramp from 1 to 10 and back to 1 stays a half-unit behind the series on every bar, so the first-order smoother never catches a constant rise or fall.
Building the two-sum correction
Linear regression is the algebraic construction that estimates both local level and slope from two explicit sums over the same N observations, then adds the slope term back to the simple average. Exponential smoothing is a second-order correction, drawn from inventory-forecast practice, that adds a recency-weighted slope sum so the estimate can track rising or falling prices instead of remaining one period behind.
The second-order construction adds a recency-weighted sum S, with older observations receiving smaller or even negative weights, then forms the corrected estimate as the simple average plus 6S divided by N times N plus one.
For a two-period window the uncorrected average is T/2, while the corrected average is that same level plus 6S over 6, using T as the sum of today and yesterday and S as half of today minus half of yesterday.
What the corrected lookback recovers
On the same unit-ramp series, two-, three-, and four-period corrected averages recover the current price with zero tabulated error once the window is full, whereas the corresponding simple averages remain lagged.
After startup, both totals can be updated recursively: T replaces the observation that drops out of the window, and S is refreshed from its prior value, the prior T, the newest price, and the price leaving the window.
On a standard cyclical price series and on a Treasury-bond series, the four-period and ten-period corrected averages track the underlying path more tightly than simple averages of the same length, which retain their usual lag.
Because the corrected average responds faster, crossover-style decision rules that assume simple-average delay need to be rechecked rather than transplanted unchanged.
Treasury bond daily prices with a modified moving average
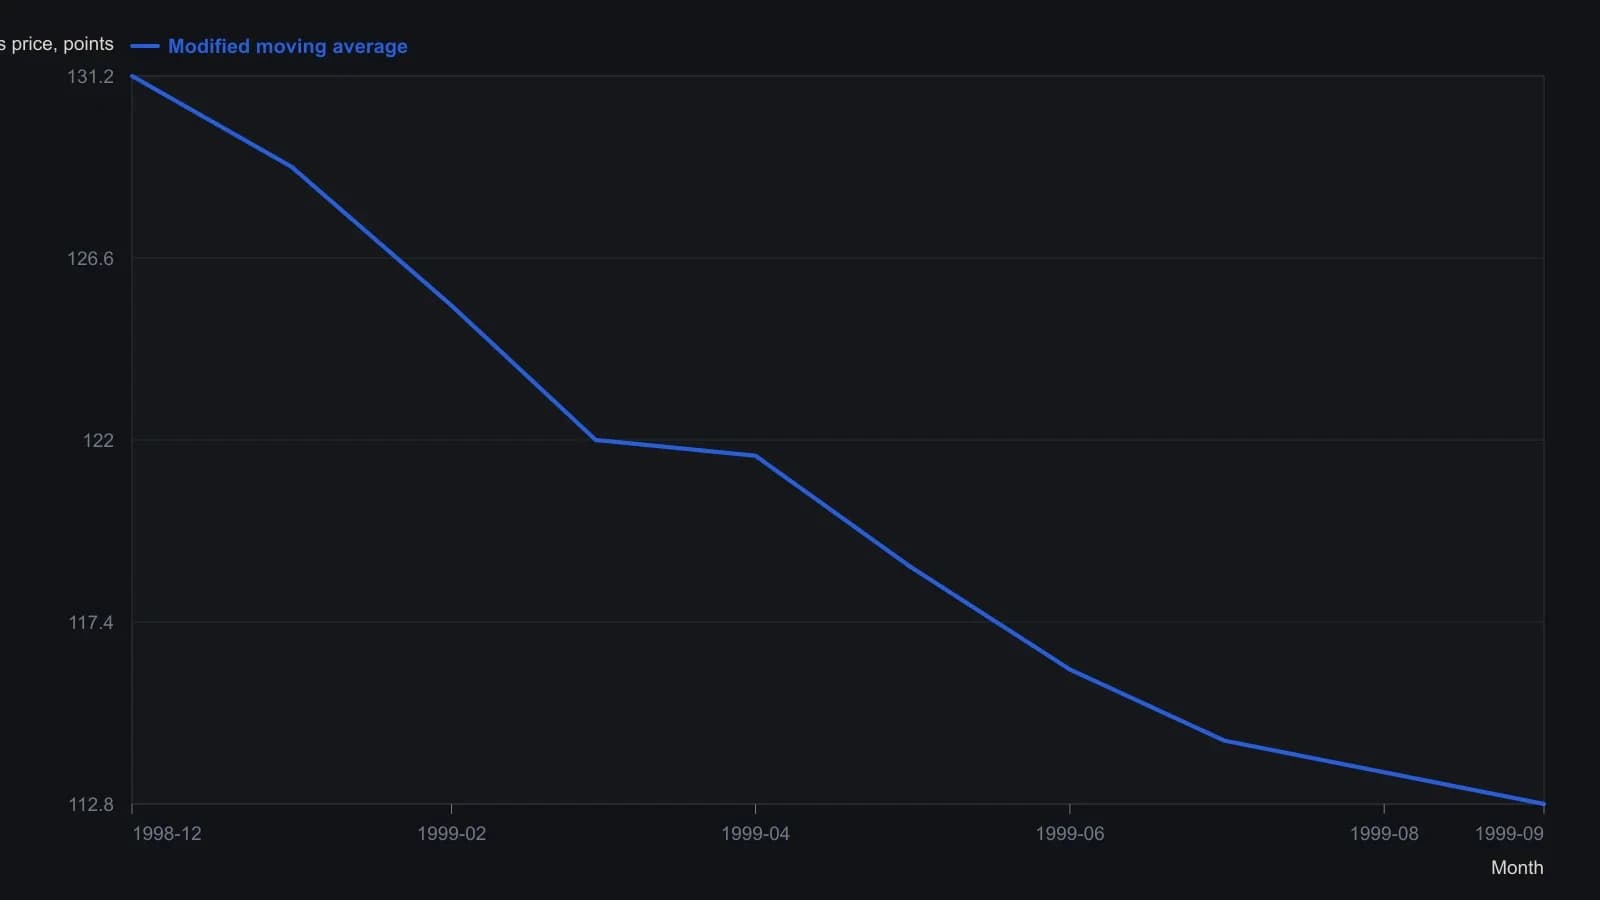
Price scale is US Treasury futures points-and-32nds converted to decimal. Digitized from the raster, so turning points are approximate and the series is capped well below the full daily bar count.
All readings on this track · 43 readings
- 1990Constructing dollar baselines from rates, inflation, and residuals
- 1990Constructing a nominal index value from forward earnings and fitted yield
- 1990Constructing a nominal index price from earnings and a fitted yield
- 1990Endpoint-pinned price paths are not forecasts
- 1990Constructing least-squares polynomial smoothers
- 1991Endpoint growth rates versus linear-regression consistency
- 1991Out-of-sample checks for linear growth fits
- 1991Trend as persistence, not a straight line
- 1991Quadratic trend, residual oscillator, and a secondary cycle calendar
- 1991Time-origin offset and residual-price divergence on a quadratic least-squares fit
- 1991A least-squares trendline from ordered prices
- 1992Constructing log-linear growth and reliability screens
- 1992Constructing log-linear growth-rate baselines
- 1992Next-session high, low, and close from rolling linear regression
- 1993Auditing an index price-earnings multiple with short-rate regression
- 1994Regression-seeded nested exponential price filter
- 1994Constructing the double exponential average from lag cancellation
- 1994Evaluating money supply as a linear leading-index baseline
- 1995Constructing least-squares trend channels
- 1995Linear baseline holdout checks for annual bill-rate forecasts
- 1995Projection bands from high and low regression slopes
- 1995Evaluating a least-squares end-point moving average on a known test series
- 1996Constructing an endpoint moving average from a least-squares line
- 1996Scoring equity path consistency with a k-ratio overlay
- 1996Evaluating month-end yield gaps for equity regimes
- 1996Constructing session-indexed standard error bands
- 1998Evaluating linear regression baselines for index valuation
- 1998R-squared as a two-state trend filter from a price-time fit
- 2000Second-order moving-average lag correction
- 2002Price regression line versus beta for index tracking
- 2003Regression slope with an r-squared trend confidence gate
- 2003Constructing finite-volume-element divergence with slope comparison
- 2004Building a daily score from regression, retracement, and volume
- 2004Constructing least-squares trendlines from ordered prices
- 2007Rectangle breakout targets beyond height
- 2007Confirming a price trend with regression slope and r-squared
- 2008A linear-regression angle assembled as one trend filter
- 2010A two-state swing machine from four running extremes
- 2016Score oil-complex tightness before divergence or regression
- 2017Nikkei-yen intermarket divergence as a regime case study
- 2017Constructing Calmar ratio and linear regression baselines
- 2019Pair-trade layer construction versus average-spread management
- 2020A convolution slope built from nested linear regression