1993issue C081-13
Auditing an index price-earnings multiple with short-rate regression
A historical least-squares workflow used a scatterplot screen to decide which interest-rate pairing could enter a linear model of an index price-earnings multiple, then treated the fit statistics as a check on the contemporaneous valuation setting.
- A scatterplot screen dropped the long-term yield pairing as nonlinear and kept the short-term yield pairing as linear enough for least-squares.
- A one-variable short-rate fit reported an adjusted R-squared of 0.76, a standard error of 0.06, and a negative coefficient, and it followed the multiple's broad direction without capturing every turning point.
- Adding index dividend yield raised adjusted R-squared to 0.88, lowered the standard error to 0.04, kept both coefficients negative, and left residuals described as largely random.
- The two-variable specification was characterized as better for judging the contemporaneous valuation setting than for producing a forecast, and the write-up recommended repeating the exercise under different interest-rate regimes.
A linear fit for an index multiple
A least-squares linear regression was used to relate ordered interest-rate and equity-yield observations to a broad equity-index price-earnings multiple. The candidate inputs were a 30-year constant-maturity Treasury yield, a 90-day Treasury-bill yield, the index dividend yield, and the same index price-earnings multiple.
Which pairing survived the screen
A scatter of long-term yields against the index multiple was judged nonlinear, so that pairing was not carried into the linear specification. A scatter of short-term yields against the index multiple was judged linear enough to justify further least-squares work.
Reading the one-variable fit
A one-variable fit of short-term rates to the multiple produced an adjusted R-squared of 0.76, a standard error of 0.06, and a negative short-rate coefficient. A visual overlay of that one-variable fit followed the multiple's broad direction but did not capture every turning point.
Adding dividend yield
Adding the index dividend yield produced a multiple linear regression against the same price-earnings multiple. Adjusted R-squared rose from 0.76 to 0.88 and the regression standard error fell from 0.06 to 0.04, with both coefficients remaining negative.
Residual plots for the two-variable fit were described as largely random, which was taken as informal evidence that leftover errors were not strongly correlated.
Short-rate and S&P yield coefficients for the S&P 500 P/E
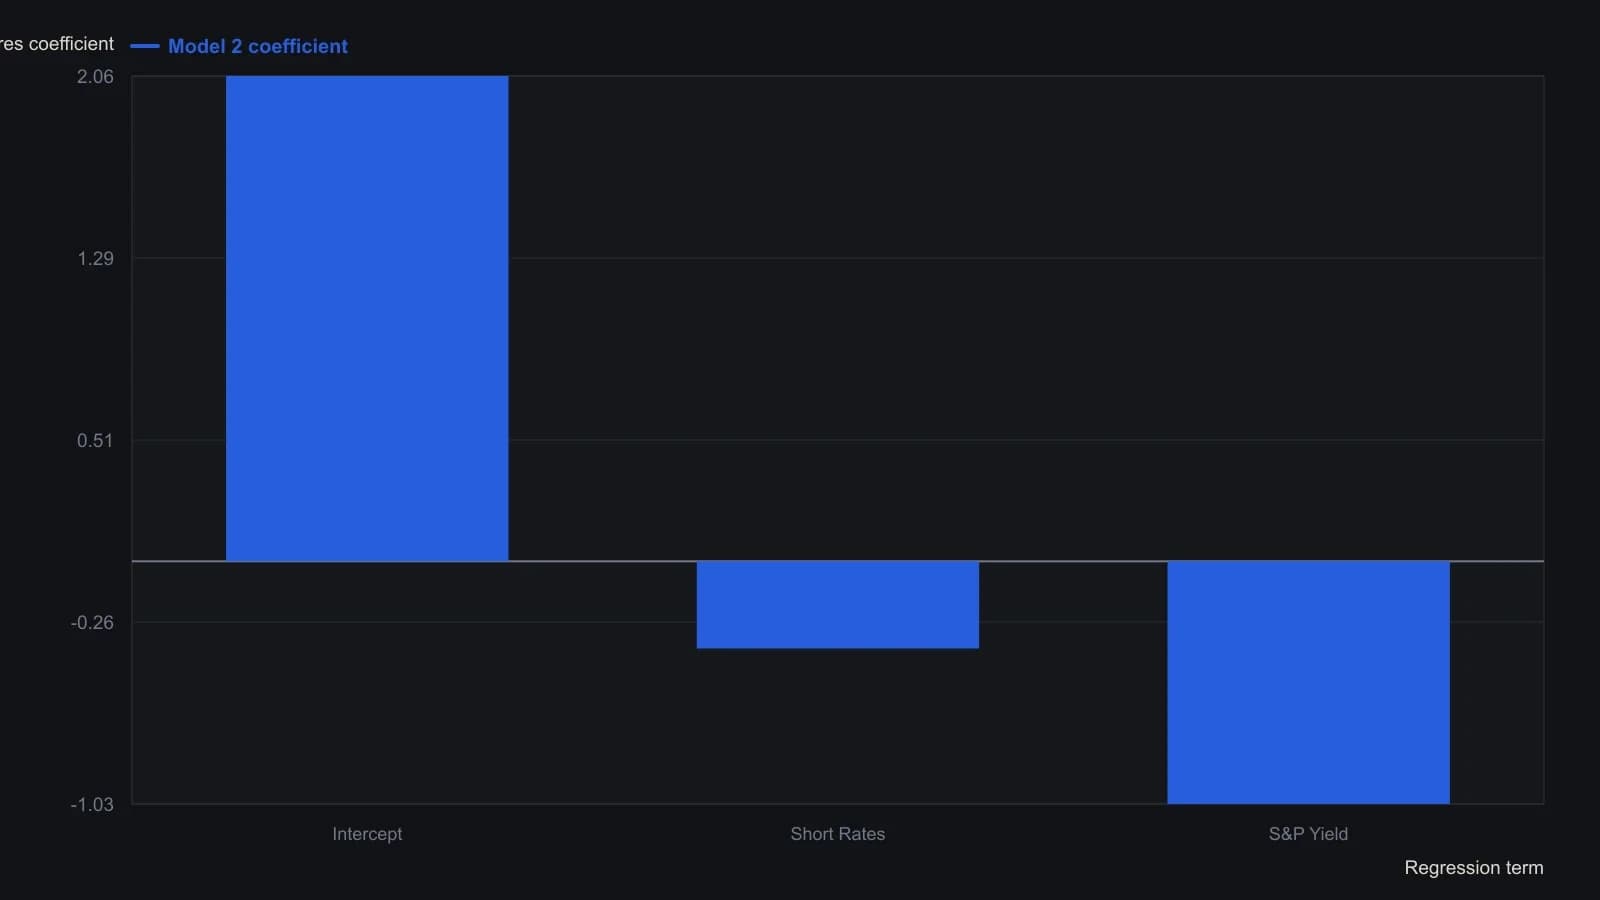
The printed table reports R-square and adjusted R-square of 0.89 and a standard error of 0.04; the article prose rounds the fit to 0.88. Karczewski treats the equation as a check on the current multiple, not a turning-point forecast, and notes that an unusually low rate regime can change the coefficients if the sample is lengthened.
A contemporaneous check, not a turning-point tool
The two-variable specification was characterized as more suitable for judging the contemporaneous valuation setting than for producing a forecast.
The write-up recommended repeating the least-squares exercise under different interest-rate regimes because the method tends to force a fit toward the bulk of the sample.
All readings on this track · 43 readings
- 1990Constructing dollar baselines from rates, inflation, and residuals
- 1990Constructing a nominal index value from forward earnings and fitted yield
- 1990Constructing a nominal index price from earnings and a fitted yield
- 1990Endpoint-pinned price paths are not forecasts
- 1990Constructing least-squares polynomial smoothers
- 1991Endpoint growth rates versus linear-regression consistency
- 1991Out-of-sample checks for linear growth fits
- 1991Trend as persistence, not a straight line
- 1991Quadratic trend, residual oscillator, and a secondary cycle calendar
- 1991Time-origin offset and residual-price divergence on a quadratic least-squares fit
- 1991A least-squares trendline from ordered prices
- 1992Constructing log-linear growth and reliability screens
- 1992Constructing log-linear growth-rate baselines
- 1992Next-session high, low, and close from rolling linear regression
- 1993Auditing an index price-earnings multiple with short-rate regression
- 1994Regression-seeded nested exponential price filter
- 1994Constructing the double exponential average from lag cancellation
- 1994Evaluating money supply as a linear leading-index baseline
- 1995Constructing least-squares trend channels
- 1995Linear baseline holdout checks for annual bill-rate forecasts
- 1995Projection bands from high and low regression slopes
- 1995Evaluating a least-squares end-point moving average on a known test series
- 1996Constructing an endpoint moving average from a least-squares line
- 1996Scoring equity path consistency with a k-ratio overlay
- 1996Evaluating month-end yield gaps for equity regimes
- 1996Constructing session-indexed standard error bands
- 1998Evaluating linear regression baselines for index valuation
- 1998R-squared as a two-state trend filter from a price-time fit
- 2000Second-order moving-average lag correction
- 2002Price regression line versus beta for index tracking
- 2003Regression slope with an r-squared trend confidence gate
- 2003Constructing finite-volume-element divergence with slope comparison
- 2004Building a daily score from regression, retracement, and volume
- 2004Constructing least-squares trendlines from ordered prices
- 2007Rectangle breakout targets beyond height
- 2007Confirming a price trend with regression slope and r-squared
- 2008A linear-regression angle assembled as one trend filter
- 2010A two-state swing machine from four running extremes
- 2016Score oil-complex tightness before divergence or regression
- 2017Nikkei-yen intermarket divergence as a regime case study
- 2017Constructing Calmar ratio and linear regression baselines
- 2019Pair-trade layer construction versus average-spread management
- 2020A convolution slope built from nested linear regression