2010issue C0971-83
A two-state swing machine from four running extremes
Swing-state stays up or down from four running extremes and flips only on a completed range-clear. The mechanical procedure then uses a next-bar-market-entry so the always-in-reversal can be tested as one rule-based-entry. Editorial note: a linear-regression-baseline on the same series is a forecast comparison, not part of the flip rule.
- Swing-state stays up until a completed high falls below the running highest low, and stays down until a completed low rises above the running lowest high.
- While swing-state is up the mechanical procedure buys the next bar at market; while it is down the procedure sells short the next bar at market.
- A close-only reconstruction exposes no user parameters and refreshes the four running extremes when a new bar starts; raising pivot-strength above 2 lengthens swings past a one-bar pivot.
- The same flip rules were shown as bar coloring, an UP versus DN status list, a price-and-volume status scan, and a nested switch after a 10-bar highest low or 10-bar lowest high is cleared.
Swing-state from four running extremes
Swing-state is a binary label. It stays up until a completed high falls below the running highest low. It stays down until a completed low rises above the running lowest high.
The live reference level is the swing-line: the highest low during an upswing, or the lowest high during a downswing. A range-clear is the completed bar whose high falls below the highest low, or whose low rises above the lowest high, and thereby flips swing-state.
Daily GE swing line, October 2008 to January 2009
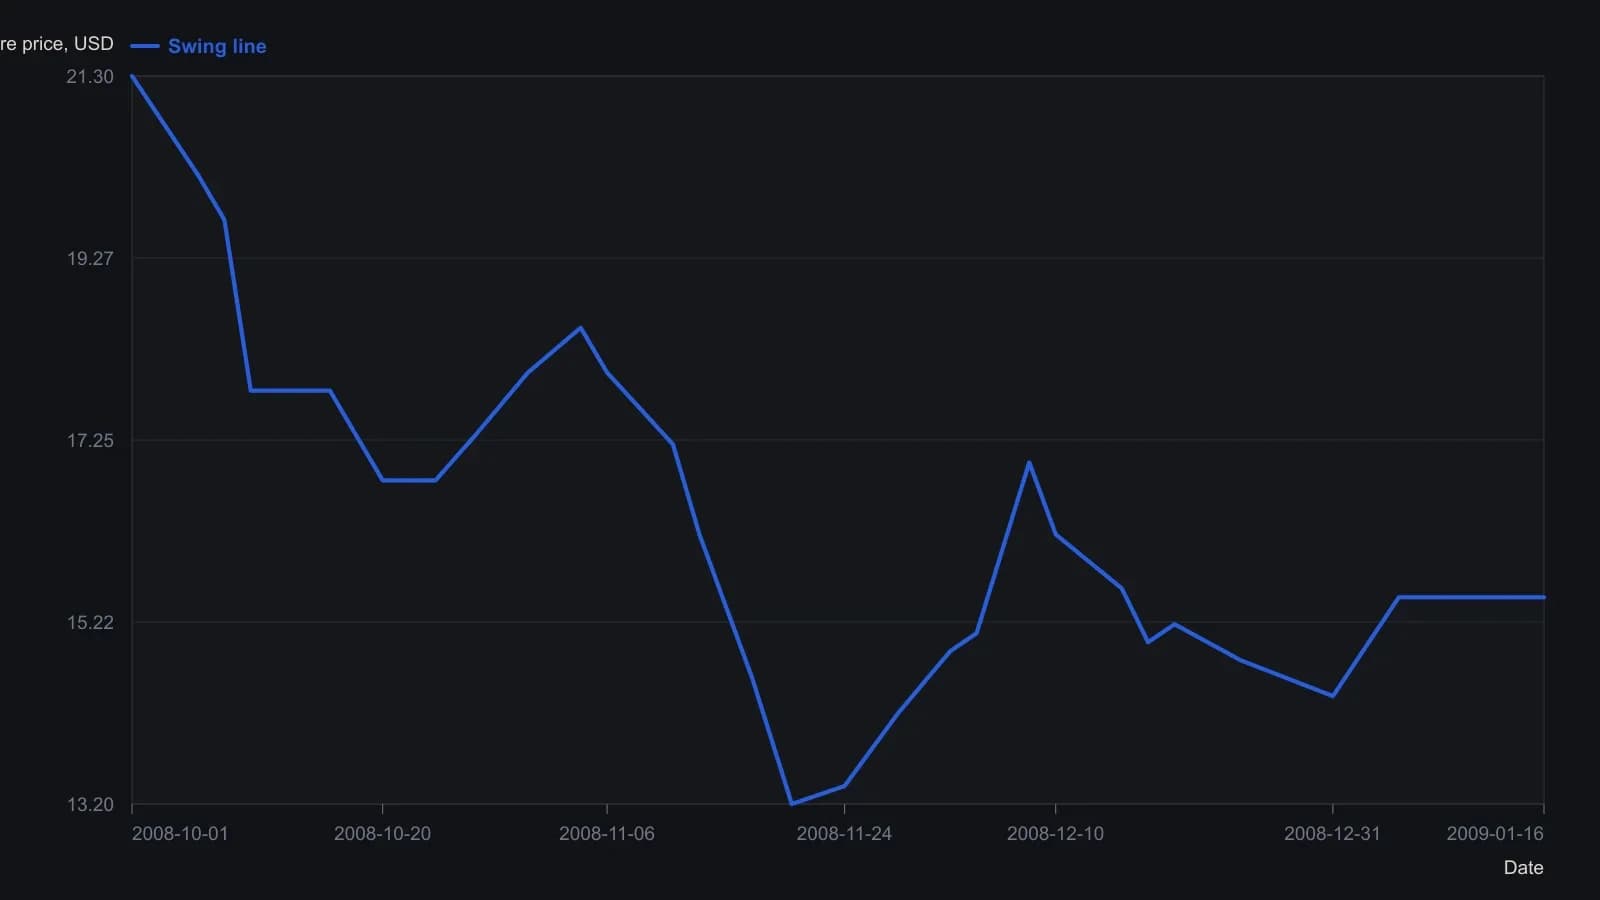
The screenshot plots only the active extreme, so the line is gapped at each state flip. Companion code enters next bar at market because a session high and low are unknown until that bar closes.
Always-in-reversal and next-bar-market-entry
While swing-state is up, the mechanical procedure buys the next bar at market. While swing-state is down, the procedure sells short the next bar at market. That pairing is the always-in-reversal.
The order is a next-bar-market-entry because the triggering extreme is known only once the bar that created the range-clear has closed. The rule-based-entry fires only when the published clear condition is met, so entry, exit, and abstention stay inside one procedure.
One daily illustration delays the entry until the second bar after the swing-line is cleared, because that session extreme is known only after the close.
A close-only reconstruction and pivot-strength
One close-only reconstruction exposes no user parameters. It refreshes the four running extremes when a new bar starts.
The original construction uses a one-bar pivot. Raising an added pivot-strength input above 2 lengthens swings past that one-bar definition.
The same flip rules without a drawn line
A status scan kept names above a 10-dollar price and a one-million-share average daily volume, then labeled each survivor as an upswing or a downswing.
The same flip rules were also shown as bar coloring and as an UP versus DN status list that does not draw a line. One nested formula keeps the prior swing level and switches only after a 10-bar highest low or a 10-bar lowest high is cleared.
Lower-interval clears and higher-interval direction
A construction note suggests taking lower-interval clear entries only when they agree with the higher-interval swing direction.
All readings on this track · 43 readings
- 1990Constructing dollar baselines from rates, inflation, and residuals
- 1990Constructing a nominal index value from forward earnings and fitted yield
- 1990Constructing a nominal index price from earnings and a fitted yield
- 1990Endpoint-pinned price paths are not forecasts
- 1990Constructing least-squares polynomial smoothers
- 1991Endpoint growth rates versus linear-regression consistency
- 1991Out-of-sample checks for linear growth fits
- 1991Trend as persistence, not a straight line
- 1991Quadratic trend, residual oscillator, and a secondary cycle calendar
- 1991Time-origin offset and residual-price divergence on a quadratic least-squares fit
- 1991A least-squares trendline from ordered prices
- 1992Constructing log-linear growth and reliability screens
- 1992Constructing log-linear growth-rate baselines
- 1992Next-session high, low, and close from rolling linear regression
- 1993Auditing an index price-earnings multiple with short-rate regression
- 1994Regression-seeded nested exponential price filter
- 1994Constructing the double exponential average from lag cancellation
- 1994Evaluating money supply as a linear leading-index baseline
- 1995Constructing least-squares trend channels
- 1995Linear baseline holdout checks for annual bill-rate forecasts
- 1995Projection bands from high and low regression slopes
- 1995Evaluating a least-squares end-point moving average on a known test series
- 1996Constructing an endpoint moving average from a least-squares line
- 1996Scoring equity path consistency with a k-ratio overlay
- 1996Evaluating month-end yield gaps for equity regimes
- 1996Constructing session-indexed standard error bands
- 1998Evaluating linear regression baselines for index valuation
- 1998R-squared as a two-state trend filter from a price-time fit
- 2000Second-order moving-average lag correction
- 2002Price regression line versus beta for index tracking
- 2003Regression slope with an r-squared trend confidence gate
- 2003Constructing finite-volume-element divergence with slope comparison
- 2004Building a daily score from regression, retracement, and volume
- 2004Constructing least-squares trendlines from ordered prices
- 2007Rectangle breakout targets beyond height
- 2007Confirming a price trend with regression slope and r-squared
- 2008A linear-regression angle assembled as one trend filter
- 2010A two-state swing machine from four running extremes
- 2016Score oil-complex tightness before divergence or regression
- 2017Nikkei-yen intermarket divergence as a regime case study
- 2017Constructing Calmar ratio and linear regression baselines
- 2019Pair-trade layer construction versus average-spread management
- 2020A convolution slope built from nested linear regression