1995issue C051-8
Linear baseline holdout checks for annual bill-rate forecasts
Candidate predictors for three-month bill yields were screened for lead, then a lagged linear mapping from ordered indicator history forecast the next year's average bill rate. Accuracy was read after a chronological holdout split, with a survey consensus and a futures-implied reading lined up on the same one-year horizon.
- Many financial price and rate series moved with three-month bill yields, so they behaved as coincident series and supplied little lead.
- Three composite leading-indicator series plus a money-supply series were retained because they often turned before bill yields, yet lead-lag correlation showed only a weak-to-moderate leading association.
- A linear mapping used ordered indicator history from a bounded lookback to produce the next year's average bill rate, and fitting stopped at a preset residual tolerance rather than a trading objective.
- Accuracy was read on a chronological out-of-sample window, and the same one-year horizon lined up the quantitative forecast with a survey consensus and a futures-implied reading.
Screening for a usable lead
When candidate predictors for three-month bill yields were screened, many financial price and rate series moved with the target and therefore supplied little lead. Those readings are coincident series: they track the target at the same time and cannot supply a usable lead.
A leading indicator tends to change direction before the target yield rather than moving with it or after it. Three composite leading-indicator series plus a money-supply series were retained because they often turned before bill yields.
Lead-lag correlation charts showed only a weak-to-moderate leading association between those retained indicators and current bill rates.
Cross-correlation of LEI with 91-day T-bill rates
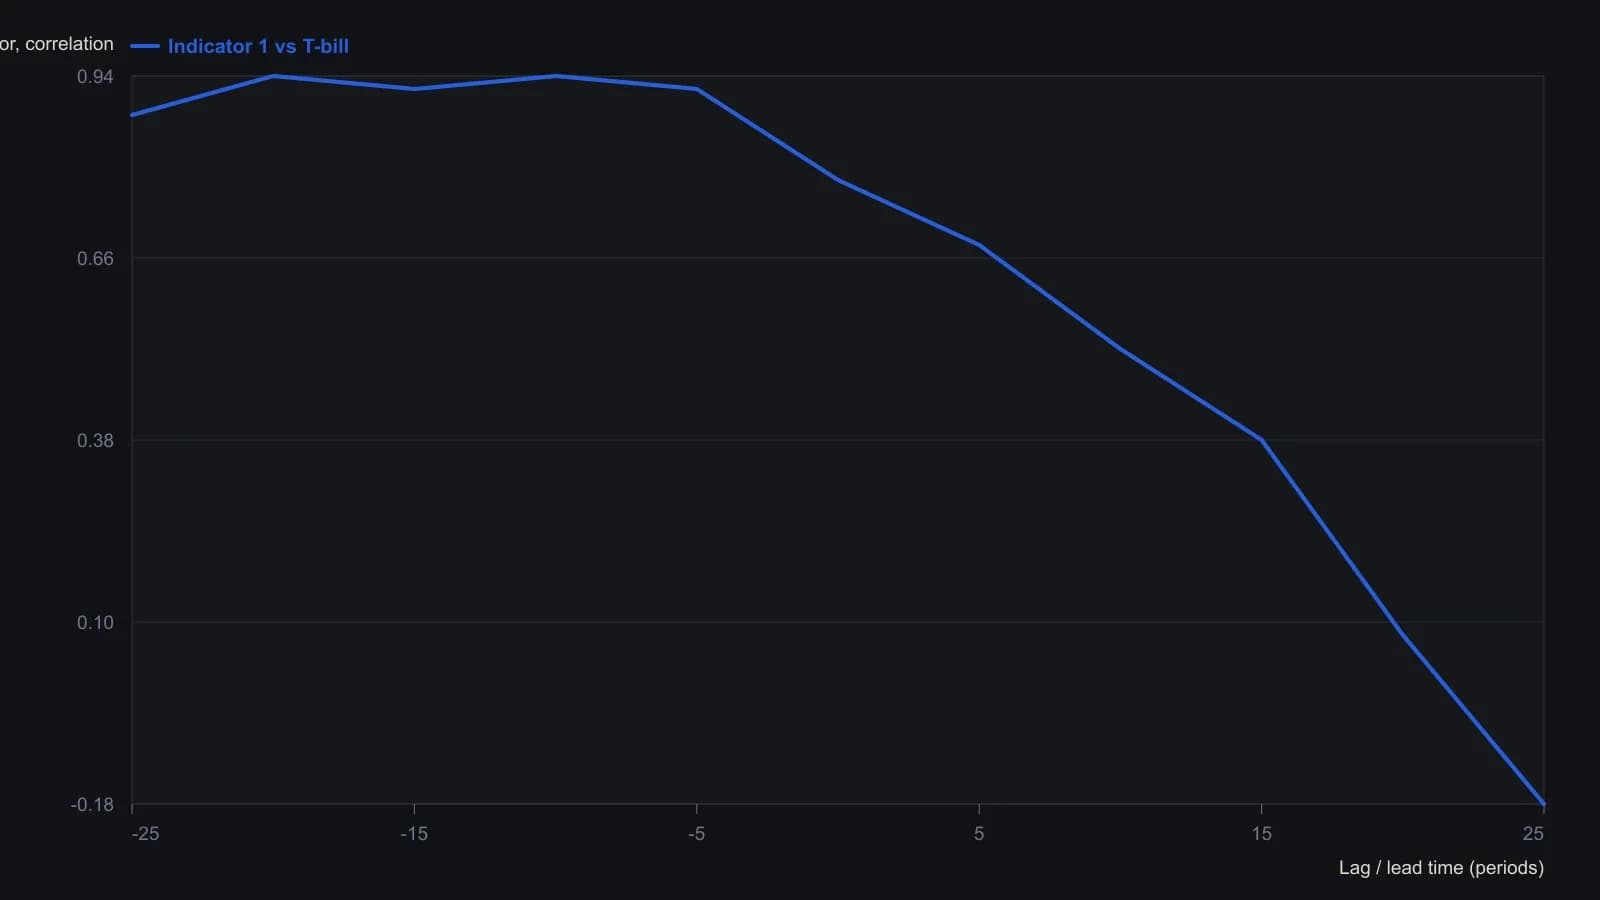
Heights are approximate readings from the printed 0.2-grid; NeuroForecaster did not print numeric correlation values.
A lagged linear mapping with a bounded lookback
The fitted mapping used ordered indicator history from the prior four years to produce the next year's average bill rate. Linear regression here is a fitted linear mapping from those lagged, ordered observations to a single-horizon forecast.
The lookback is the fixed span of past indicator readings supplied as inputs for one forecast. The annual-average horizon is a one-year sampling interval in which the target is the coming year's average short-term bill rate.
Training windows were rolled forward year by year, and older observations were later dropped so the lookback stayed bounded. Fitting stopped when residual learning error reached a preset tolerance, which is an in-sample stopping rule rather than a trading objective.
Holdout accuracy at a shared one-year horizon
Accuracy was read on observations after a chronological holdout split, not only on the sample used to fit the mapping. That reserved stretch is the out-of-sample window, so forecast error is scored on data the mapping was not trained on.
Absolute forecast error, the unsigned gap between a one-year-ahead estimate and the realized average rate, is used only as an evaluation metric.
The same one-year horizon was used to line up a survey consensus, a futures-implied reading, and the quantitative forecast.
All readings on this track · 43 readings
- 1990Constructing dollar baselines from rates, inflation, and residuals
- 1990Constructing a nominal index value from forward earnings and fitted yield
- 1990Constructing a nominal index price from earnings and a fitted yield
- 1990Endpoint-pinned price paths are not forecasts
- 1990Constructing least-squares polynomial smoothers
- 1991Endpoint growth rates versus linear-regression consistency
- 1991Out-of-sample checks for linear growth fits
- 1991Trend as persistence, not a straight line
- 1991Quadratic trend, residual oscillator, and a secondary cycle calendar
- 1991Time-origin offset and residual-price divergence on a quadratic least-squares fit
- 1991A least-squares trendline from ordered prices
- 1992Constructing log-linear growth and reliability screens
- 1992Constructing log-linear growth-rate baselines
- 1992Next-session high, low, and close from rolling linear regression
- 1993Auditing an index price-earnings multiple with short-rate regression
- 1994Regression-seeded nested exponential price filter
- 1994Constructing the double exponential average from lag cancellation
- 1994Evaluating money supply as a linear leading-index baseline
- 1995Constructing least-squares trend channels
- 1995Linear baseline holdout checks for annual bill-rate forecasts
- 1995Projection bands from high and low regression slopes
- 1995Evaluating a least-squares end-point moving average on a known test series
- 1996Constructing an endpoint moving average from a least-squares line
- 1996Scoring equity path consistency with a k-ratio overlay
- 1996Evaluating month-end yield gaps for equity regimes
- 1996Constructing session-indexed standard error bands
- 1998Evaluating linear regression baselines for index valuation
- 1998R-squared as a two-state trend filter from a price-time fit
- 2000Second-order moving-average lag correction
- 2002Price regression line versus beta for index tracking
- 2003Regression slope with an r-squared trend confidence gate
- 2003Constructing finite-volume-element divergence with slope comparison
- 2004Building a daily score from regression, retracement, and volume
- 2004Constructing least-squares trendlines from ordered prices
- 2007Rectangle breakout targets beyond height
- 2007Confirming a price trend with regression slope and r-squared
- 2008A linear-regression angle assembled as one trend filter
- 2010A two-state swing machine from four running extremes
- 2016Score oil-complex tightness before divergence or regression
- 2017Nikkei-yen intermarket divergence as a regime case study
- 2017Constructing Calmar ratio and linear regression baselines
- 2019Pair-trade layer construction versus average-spread management
- 2020A convolution slope built from nested linear regression