2003issue C041-14
Constructing finite-volume-element divergence with slope comparison
A finite-volume-element oscillator signs each bar only after a close-scaled money-flow cutoff, then compares 35-bar linear-regression slopes of the oscillator and of close so price-indicator divergence can be stated as a next-bar rule.
- Typical price and a close-versus-midpoint money-flow term set each bar to +1, -1, or 0 only after a close-scaled money-flow cutoff, with a default cutoff of 0.003.
- After a 22-bar window, signed volume is summed, divided by average volume times the sample length, and scaled by 100 so the oscillator can be compared with price.
- Price-indicator divergence is operationalized as opposite 35-bar linear-regression slopes of the oscillator and of close, with an optional scale factor for a shared pane.
- One mechanical construction buys the next bar when the oscillator crosses above -5 under that slope-sign pair, and exits on a negative 25-bar oscillator slope or a 50-session calendar-adjusted hold.
What the oscillator measures
The finite-volume-element is a bounded oscillator that assigns each bar a signed volume contribution after a money-flow cutoff, then scales the rolling signed-volume sum by average volume so the result can be compared with price.
The oscillator first forms typical price as the mean of high, low, and close, then builds a money-flow term from the close versus the bar midpoint plus the change in typical price. That pairing is volume-price-analysis: intra-bar location of the close and the change in typical price, together with volume, decide whether a bar adds to or subtracts from the oscillator.
Signing volume with a money-flow cutoff
A bar is signed +1, -1, or 0 only after that money-flow term is compared with a cutoff scaled by close. The money-flow-cutoff is a price-scaled threshold that classifies a bar as positive, negative, or neutral volume instead of treating every close-to-close move as signed flow. The default cutoff shown is 0.003.
After a 22-bar sample window, signed volume is summed, divided by average volume times the sample length, and scaled by 100 to produce the oscillator.
Divergence as opposite regression slopes
Price-indicator-divergence is a condition in which the linear-regression slope of the oscillator and the linear-regression slope of price have opposite signs. Divergence is operationalized by comparing a 35-bar linear-regression slope of the oscillator with a 35-bar linear-regression slope of close, with an optional scale factor so the two slopes can be plotted on one pane.
The linear-regression-slope is a fitted trend of an ordered series over a stated lookback, used here as a comparable baseline for oscillator trend versus price trend.
FVE on daily Manugistics (MANU), July–December 2002
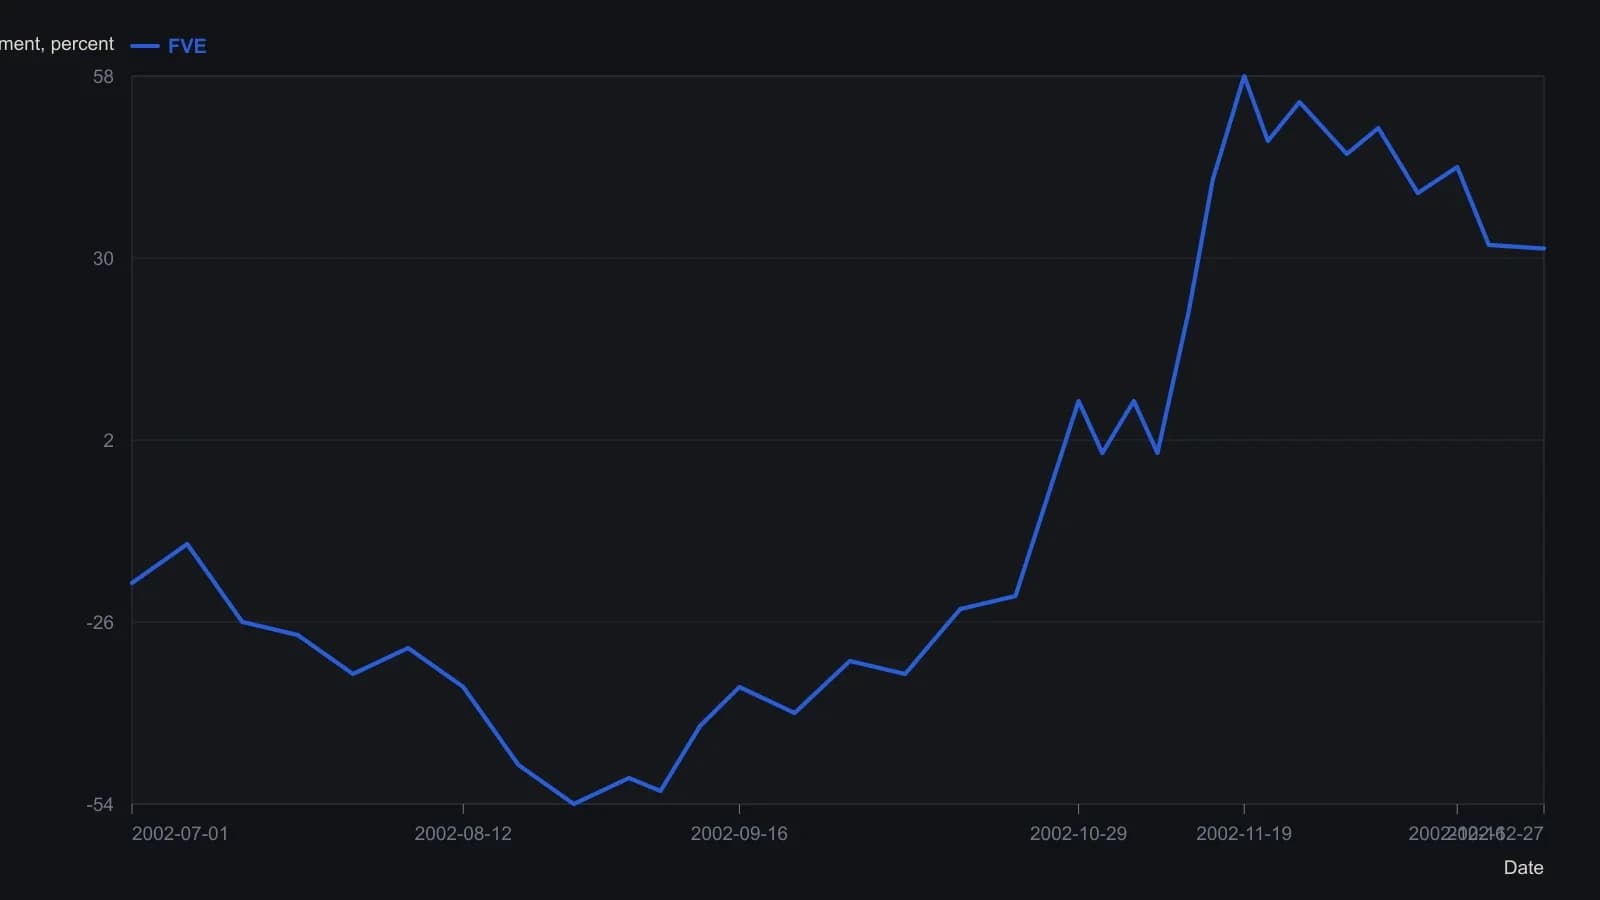
Except for the terminal FVE print of 31.4381, values are digitized from the raster and are only good to a few oscillator points. The screenshot does not print a year; the TradeStation MANU chart in the same tip, captured 17 February 2003, places this July–December span in 2002. AmiBroker does not label the FVE lookback on the pane; the accompanying BackTest EZ dialog uses a 21-bar FVE.
A next-bar entry and timed exit
One mechanical rule buys the next bar when the oscillator crosses above -5 while its 35-bar slope is positive and the 35-bar price slope is negative. The same construction exits when the oscillator’s 25-bar linear-regression slope is negative or the position has aged beyond a 50-session calendar-adjusted hold.
The same signed-volume oscillator, 35-bar slope-sign comparison, and cross of the oscillator through -5 appear as a coded long-entry test in more than one platform recipe.
A second volume-price pair and other detectors
A second volume-price pair updates a positive-volume series only on up-volume bars and a negative-volume series otherwise, each adding the close-to-close percent change. That pair can be computed as a running sum from the first bar or as a fixed-length window sum, with example windows of 200 bars and moving-average lengths of 12 or 127.
An alternative divergence detector normalizes successive oscillator peaks and successive price peaks over a lookback range, then subtracts the two normalized peak changes. A third detector uses a percent-B style comparison.
All readings on this track · 43 readings
- 1990Constructing dollar baselines from rates, inflation, and residuals
- 1990Constructing a nominal index value from forward earnings and fitted yield
- 1990Constructing a nominal index price from earnings and a fitted yield
- 1990Endpoint-pinned price paths are not forecasts
- 1990Constructing least-squares polynomial smoothers
- 1991Endpoint growth rates versus linear-regression consistency
- 1991Out-of-sample checks for linear growth fits
- 1991Trend as persistence, not a straight line
- 1991Quadratic trend, residual oscillator, and a secondary cycle calendar
- 1991Time-origin offset and residual-price divergence on a quadratic least-squares fit
- 1991A least-squares trendline from ordered prices
- 1992Constructing log-linear growth and reliability screens
- 1992Constructing log-linear growth-rate baselines
- 1992Next-session high, low, and close from rolling linear regression
- 1993Auditing an index price-earnings multiple with short-rate regression
- 1994Regression-seeded nested exponential price filter
- 1994Constructing the double exponential average from lag cancellation
- 1994Evaluating money supply as a linear leading-index baseline
- 1995Constructing least-squares trend channels
- 1995Linear baseline holdout checks for annual bill-rate forecasts
- 1995Projection bands from high and low regression slopes
- 1995Evaluating a least-squares end-point moving average on a known test series
- 1996Constructing an endpoint moving average from a least-squares line
- 1996Scoring equity path consistency with a k-ratio overlay
- 1996Evaluating month-end yield gaps for equity regimes
- 1996Constructing session-indexed standard error bands
- 1998Evaluating linear regression baselines for index valuation
- 1998R-squared as a two-state trend filter from a price-time fit
- 2000Second-order moving-average lag correction
- 2002Price regression line versus beta for index tracking
- 2003Regression slope with an r-squared trend confidence gate
- 2003Constructing finite-volume-element divergence with slope comparison
- 2004Building a daily score from regression, retracement, and volume
- 2004Constructing least-squares trendlines from ordered prices
- 2007Rectangle breakout targets beyond height
- 2007Confirming a price trend with regression slope and r-squared
- 2008A linear-regression angle assembled as one trend filter
- 2010A two-state swing machine from four running extremes
- 2016Score oil-complex tightness before divergence or regression
- 2017Nikkei-yen intermarket divergence as a regime case study
- 2017Constructing Calmar ratio and linear regression baselines
- 2019Pair-trade layer construction versus average-spread management
- 2020A convolution slope built from nested linear regression