1986issue C031-11
Constructing a commodity channel index and a regression price channel
Build the commodity channel index from typical price and a dominant-cycle window, then draw a residual envelope around a correlation-selected trendline. The two objects share one bar series and can describe the same swing or issue conflicting edge readings.
- The commodity channel index starts from typical price, uses a dominant-cycle moving average and mean deviation, and scales the current gap so that most readings fall inside a plus-or-minus 100 band.
- The price channel is a residual envelope around a best-fit trendline whose length is locked when lengthening the fit no longer raises correlation at the same sign.
- Price near a channel edge is read as a tendency to turn back inside the band; a failure to turn invalidates the current envelope.
- The trend-aligned filter excludes edge or index crossings that oppose the slope of the major fitted line, and several cycles of similar strength can produce conflicting or premature edge readings.
Two constructions on one bar series
The archive workflow builds a statistical index and a geometric price channel on the same bars. They share the series, but they are not interchangeable pictures of the same calculation.
The index is a scaled ratio of the current typical-price gap from its moving average to the mean deviation of that gap. The price channel is a pair of parallel boundaries drawn around a fitted straight trendline so that recent price is expected to oscillate between those edges.
Typical price and the commodity channel index
Typical price is a single bar value formed by averaging the high, low, and close before any channel or index calculation.
The statistical index is constructed from typical price by taking a moving average, measuring mean absolute deviation from that average, and dividing the current gap by that deviation times 0.015 so that most readings fall inside a plus-or-minus 100 band.
The moving-average window for that index may be set to an estimated dominant cycle. The original suggested range is 5 to 25 observations, and the supplied construction accepts an integer cycle length from 5 through 60.
A residual envelope around a fitted line
A geometric channel is centered on a best-fit straight trendline whose length is found by starting a short trial fit and lengthening it in five-observation steps until the correlation with price stops increasing at the same sign. That lookback is the correlation-selected length.
After the highest-correlation length is locked, channel edges are placed at the average of the largest positive and negative residuals from that fitted line. That half-width is the residual envelope.
Channel length may be taken from that automatic search or entered manually as an integer between 10 and 60 observations.
How an edge is read
The overlay's working hypothesis is that price near a channel edge tends to turn back inside the band. A failure to turn is treated as a breakout that invalidates the current envelope.
A second construction rule, the trend-aligned filter, excludes entries that go against the slope of the major fitted trendline, even when price is at a channel edge or the statistical index is extended.
When the two pictures agree
On a series with a single well-defined cycle, the index and the regression envelope tend to describe the same swings. When several cycles of similar strength are present, the same construction can issue conflicting or premature edge readings.
Worked charts show that automatic length search with a 12-observation cycle can produce a visually short envelope, while a manually set 30-observation length on the same cycle setting traces a clearer trend-centered band.
Typical price tape for the mixed-cycle channel example
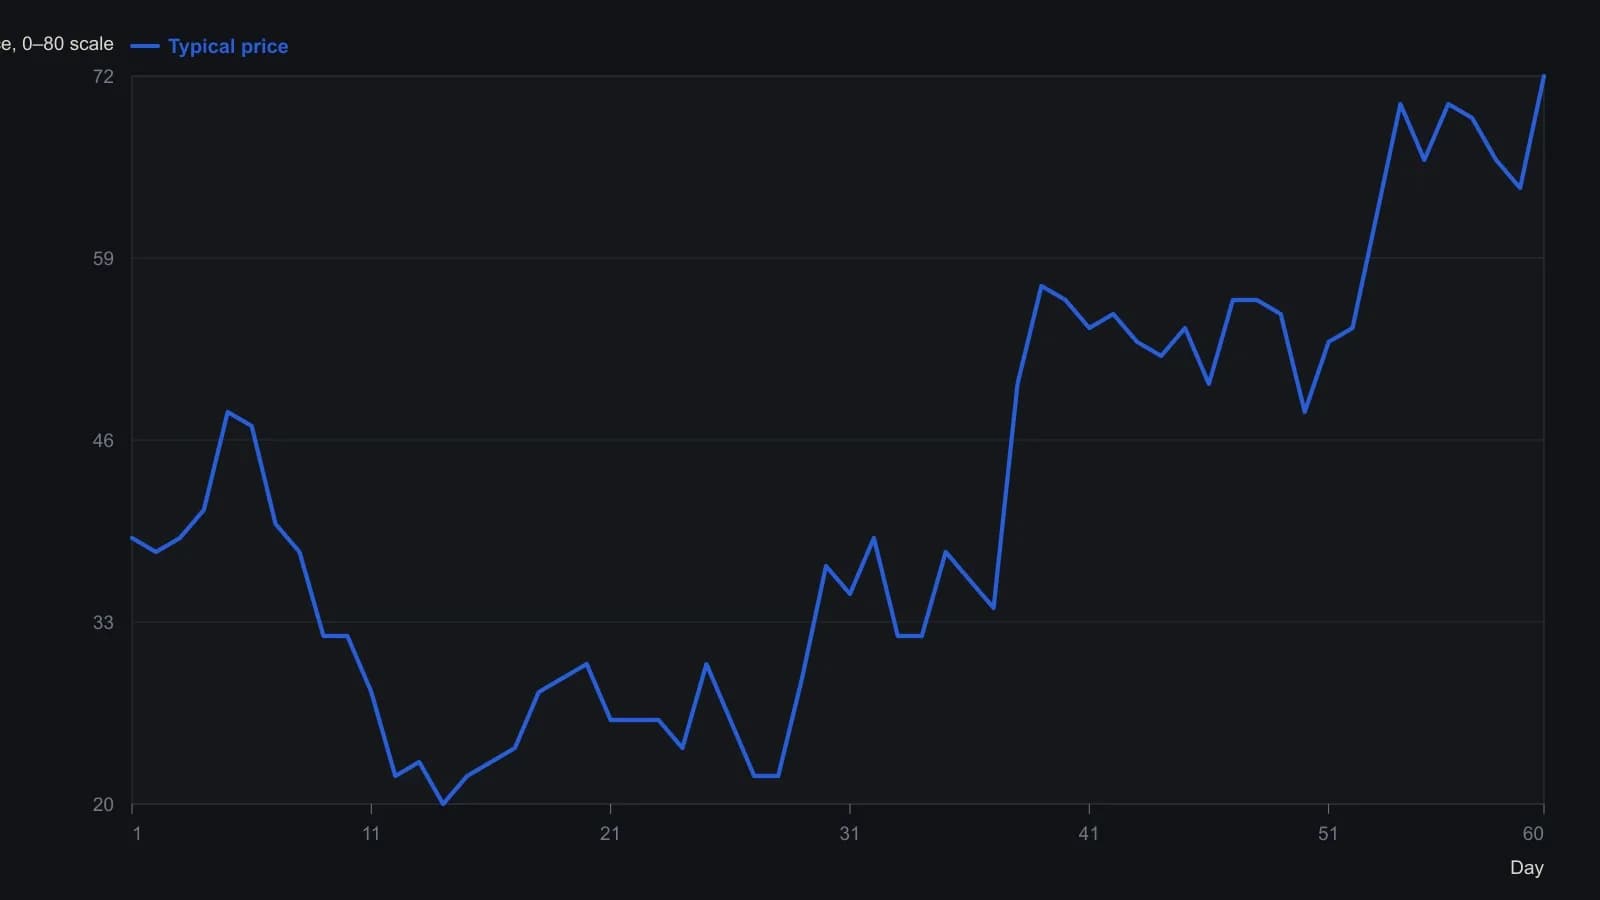
Each point is typical price, the mean of high, low and close, scaled to the 0–80 window the Apple II routine requires. This tape is the 10-day automatic-length example.
All readings on this track · 39 readings
- 1982Three gates on a 1982 pork-belly short
- 1982Scale-free Commodity Channel Index construction
- 1986Constructing a commodity channel index and a regression price channel
- 1987Constructing scaled OHLC matrices for study overlays
- 1987Constructing the commodity channel, average directional, and relative strength indexes on a shared cycle scale
- 1992Eleven-bar commodity channel index from typical price and mean deviation
- 1992Evaluating Commodity Channel Index breakout versus range rules
- 1992Evaluating breakout and CCI rules as complete mechanical procedures
- 1993Constructing stochastic, RSI and CCI inputs for forecasts
- 1993Nested centered channels with a commodity channel index confirmation gate
- 1993Listed-option timing as three separable clocks
- 1994Constructing an eleven-period commodity channel index
- 1994Confirming Elliott wave turns with channels and the commodity channel index
- 1995Commodity Channel Index band rules lag zero-line timing
- 1995Building the commodity channel index from typical price
- 1995Staged reversal rules with commodity channel index and average channels
- 1995Commodity channel index construction from typical price to a smoothed zero line
- 2001Reader tests for unfinished lookback oscillators
- 2002Constructing the commodity channel index from typical price
- 2003Breadth-filtered commodity channel index entry and exit rules
- 2003Constructing the Commodity Channel Index from typical price and scaled deviation
- 2003A shallow, poorly participated advance is an unconfirmed trend
- 2003CCI and RSI parameter defaults as scaling conventions
- 2003A cost and capital audit of a Commodity Channel Index trade engine
- 2003Commodity channel index peak divergence as an exit after twin patterns
- 2004Constructing the Commodity Channel Index from typical price
- 2004Constructing the Commodity Channel Index from typical price and mean deviation
- 2006Building custom indicators from the Commodity Channel Index, a least squares moving average and a rule-based entry
- 2012Confirming breakouts and retracements with CCI, ADX, and averages
- 2012Stacking oscillator lookbacks into a heatmap mosaic
- 2013Constructing a consensus and volatility-normalized value oscillator
- 2013Walk-forward system evaluation with a commodity channel index and chandelier exits
- 2014Dual detrended oscillators and dual Bollinger Band channels
- 2014RSI, CCI, and moving-average trend-filter construction
- 2014Dual RSI, a moving average, and CCI as a confirmation stack
- 2017Constructing dual-average cross and channel-index filters
- 2018Treat CAM as a classification layer before confirmation becomes an entry
- 2018Four-state slope labels gated by a moving average and a commodity channel index
- 2018Deviation-Scaled Moving Average construction from a two-bar difference