1991issue C051-5
Out-of-sample checks for linear growth fits
A least-squares line is a scored growth baseline only when the lookback is locked and the next sampling interval is named. The archive compared later hit rates with the series' own rise and fall shares and asked what print would preserve the in-sample slope.
- A score from every monthly close of a broad equity index from 1947 through mid-1991, with no indicator filter, still produced more later gains than a chance model at a stated 0.999 confidence.
- When a market has risen 53 percent of intervals and fallen 47 percent, those shares are the expected frequency for a batting-average test, not a default near 0.5.
- An out-of-sample extension continues the fitted line one sampling interval past the last observed point and asks what print would preserve the in-sample slope.
- Window selection can reverse which series looks stronger; six years were treated as a comfortable base for a two-year extension only if the entire record is used.
A scored growth line
A least-squares line is a first-order fit through ordered observations that minimizes squared residuals and yields a slope treated as a constant growth rate. The archive then scored later intervals after a stated condition, using a batting average rather than leaving the slope as a description of the fitted window.
Hit rates and expected frequency
A score built from every monthly close of a broad equity index from 1947 through mid-1991, with no indicator filter, still produced more later gains than a chance model at a stated 0.999 confidence. In that hit-rate design, a random result was described as a batting average near 0.5 and confidence below 0.9.
When a market has risen 53 percent of intervals and fallen 47 percent, those shares become the expected frequency against which an indicator batting average is tested. The chance counts are the unfiltered rise and fall shares of the same series.
Taking the natural logarithm of each period close was proposed as a bias correction. The reply held that logarithms would not remove the extra time spent rising.
What the next interval must print
Comparison series were set with earnings of 1.00 in 1980 and 2.00 in 1985. Least-squares lines then produced in-sample fitted values and a calculated 1986 figure, the first year after the observed window. That calculated print is the out-of-sample extension: continue the fitted line one defined sampling interval past the last observed point to see what print would preserve the in-sample slope.
An idealized path rose in five equal 0.20 steps. Holding a 20 percent slope into 1986 implied a 2.20 value. The rates used were regression slopes rather than an average-slope statistic.
Extending the least-squares window through 1980-86, only one comparison series could keep an overall 20 percent slope after a 1986 decline. The others required a 1986 print above every figure in the prior six years.
Window selection and short spans
Window selection decides which consecutive observations enter the fit. A short favorable slice can reverse which series appears stronger.
For a span of five or six years a first-order equation was judged sufficient. Uncertainty was said to grow rapidly beyond the last actual year. Six years were treated as a comfortable base for a two-year extension only if the entire record is used.
Company A earnings: locked 1980–85 slope and 1986–87 prints
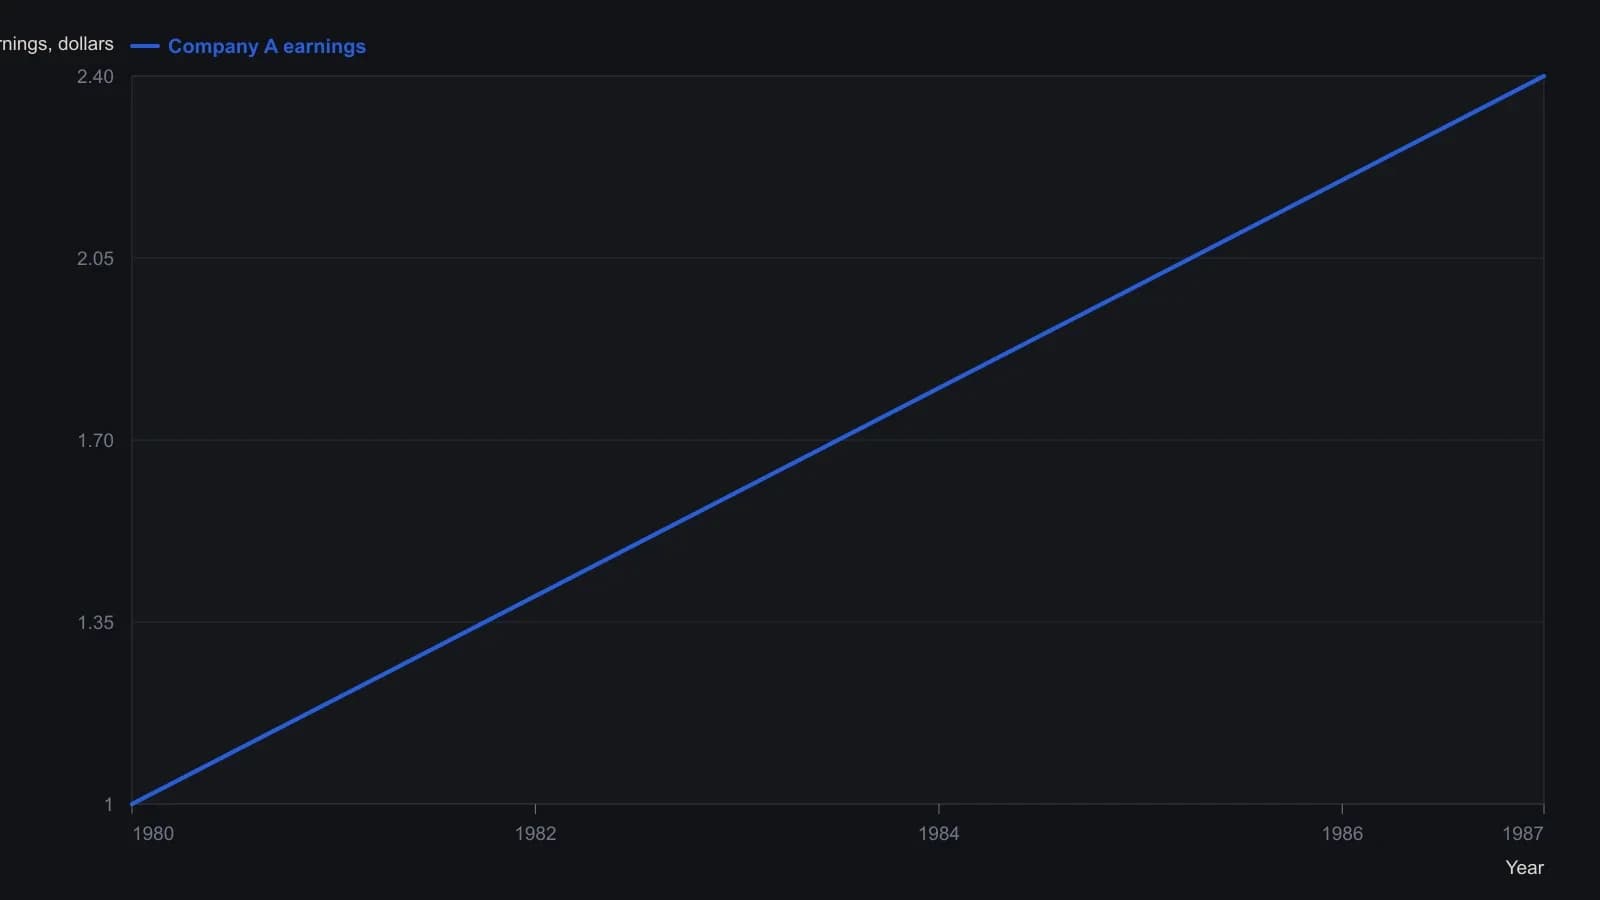
Lomartire’s 2.20 / 2.40 continue the $0.20-per-year least-squares slope, not a 20% compound rate (Mokrasch’s correction). The addendum attaches ±0.50 (1986) and ±0.54 (1987) to those two prints only.
All readings on this track · 43 readings
- 1990Constructing dollar baselines from rates, inflation, and residuals
- 1990Constructing a nominal index value from forward earnings and fitted yield
- 1990Constructing a nominal index price from earnings and a fitted yield
- 1990Endpoint-pinned price paths are not forecasts
- 1990Constructing least-squares polynomial smoothers
- 1991Endpoint growth rates versus linear-regression consistency
- 1991Out-of-sample checks for linear growth fits
- 1991Trend as persistence, not a straight line
- 1991Quadratic trend, residual oscillator, and a secondary cycle calendar
- 1991Time-origin offset and residual-price divergence on a quadratic least-squares fit
- 1991A least-squares trendline from ordered prices
- 1992Constructing log-linear growth and reliability screens
- 1992Constructing log-linear growth-rate baselines
- 1992Next-session high, low, and close from rolling linear regression
- 1993Auditing an index price-earnings multiple with short-rate regression
- 1994Regression-seeded nested exponential price filter
- 1994Constructing the double exponential average from lag cancellation
- 1994Evaluating money supply as a linear leading-index baseline
- 1995Constructing least-squares trend channels
- 1995Linear baseline holdout checks for annual bill-rate forecasts
- 1995Projection bands from high and low regression slopes
- 1995Evaluating a least-squares end-point moving average on a known test series
- 1996Constructing an endpoint moving average from a least-squares line
- 1996Scoring equity path consistency with a k-ratio overlay
- 1996Evaluating month-end yield gaps for equity regimes
- 1996Constructing session-indexed standard error bands
- 1998Evaluating linear regression baselines for index valuation
- 1998R-squared as a two-state trend filter from a price-time fit
- 2000Second-order moving-average lag correction
- 2002Price regression line versus beta for index tracking
- 2003Regression slope with an r-squared trend confidence gate
- 2003Constructing finite-volume-element divergence with slope comparison
- 2004Building a daily score from regression, retracement, and volume
- 2004Constructing least-squares trendlines from ordered prices
- 2007Rectangle breakout targets beyond height
- 2007Confirming a price trend with regression slope and r-squared
- 2008A linear-regression angle assembled as one trend filter
- 2010A two-state swing machine from four running extremes
- 2016Score oil-complex tightness before divergence or regression
- 2017Nikkei-yen intermarket divergence as a regime case study
- 2017Constructing Calmar ratio and linear regression baselines
- 2019Pair-trade layer construction versus average-spread management
- 2020A convolution slope built from nested linear regression