1994issue C011-3
Constructing the double exponential average from lag cancellation
On a noise-free linear series that has reached steady state, twice the first exponential average minus the second recovers the original series at every time index. Formal seeds from a linear-regression intercept and slope make that match exact; a first-observation seed does not.
- On a noise-free exact linear series that has already reached steady state, twice the first exponential average minus the second recovers the original series at every time index.
- On the worked linear series both exponential averages are straight lines parallel to the data, each delayed by the same lag of 5 sampling intervals.
- Formal seeds from a linear-regression intercept and slope make the constructed series coincide with the linear data, while a first-observation seed does not.
- A short sample paired with a long window makes a first-value seed less faithful, so the construction should not be judged over the first two windows unless that early segment is the object of study.
The identity on a linear series
The double exponential average is the constructed series equal to twice the first exponential average minus a second exponential average of that first average. Exponential smoothing is a recursive smoother that blends the newest observation with the previous smoothed value through a constant alpha. On a noise-free exact linear series that has already reached steady state, twice the first exponential average minus the second exponential average recovers the original series at every time index.
The worked construction
The worked linear construction uses intercept 25, slope 5, window 11, smoothing constant 0.167, and a single-average lag of 5 sampling intervals. The smoothing constant is alpha, defined as two divided by one plus the averaging window. Lag is the time shift of an exponential average on a linear series, equal to one minus alpha over alpha, or to half of one less than the window.
On that linear series both exponential averages are straight lines parallel to the data. The first is delayed by one lag and the second is delayed by another lag of the same size.
How the two lags cancel
A moving average is a lookback smoother whose window sets both responsiveness and the lag that a second smoother is meant to offset. Under the linear model the first exponential average equals the series minus slope times lag and the second equals the first minus slope times lag. That pairing rearranges to the double-exponential identity.
Editorial: read the second smoother as an estimate of the first smoother's displacement on a locally linear series. Putting that estimated displacement back is the construction itself, not a later test of the filter.
Initialization and seeds
Initialization is the starting values chosen for the two recursive averages before they reach a steady state. Formal seeds are taken from a linear-regression intercept and slope on a subset of the sample. Linear regression is a straight-line fit whose intercept and slope supply formal seed values for the two nested exponential averages. Those seeds make the constructed series coincide with the linear data, while a first-observation seed does not.
With a first-observation seed the first exponential average still lags by 5 intervals and the second by 10. The double exponential average lags by about one interval at time equal to the window and shows no significant lag after two windows.
At two windows the linear series equals 135 and the first-value-seeded construction equals 133.34, a -1.2 percent reconstruction error. At the sample end the figures are 230 and 229.903.
The first two windows
A short sample paired with a long window makes a first-value seed less faithful, so the construction should not be judged over the first two windows unless that early segment is the object of study.
EMA1 and EMA2 lag a noise-free linear series by one and two windows
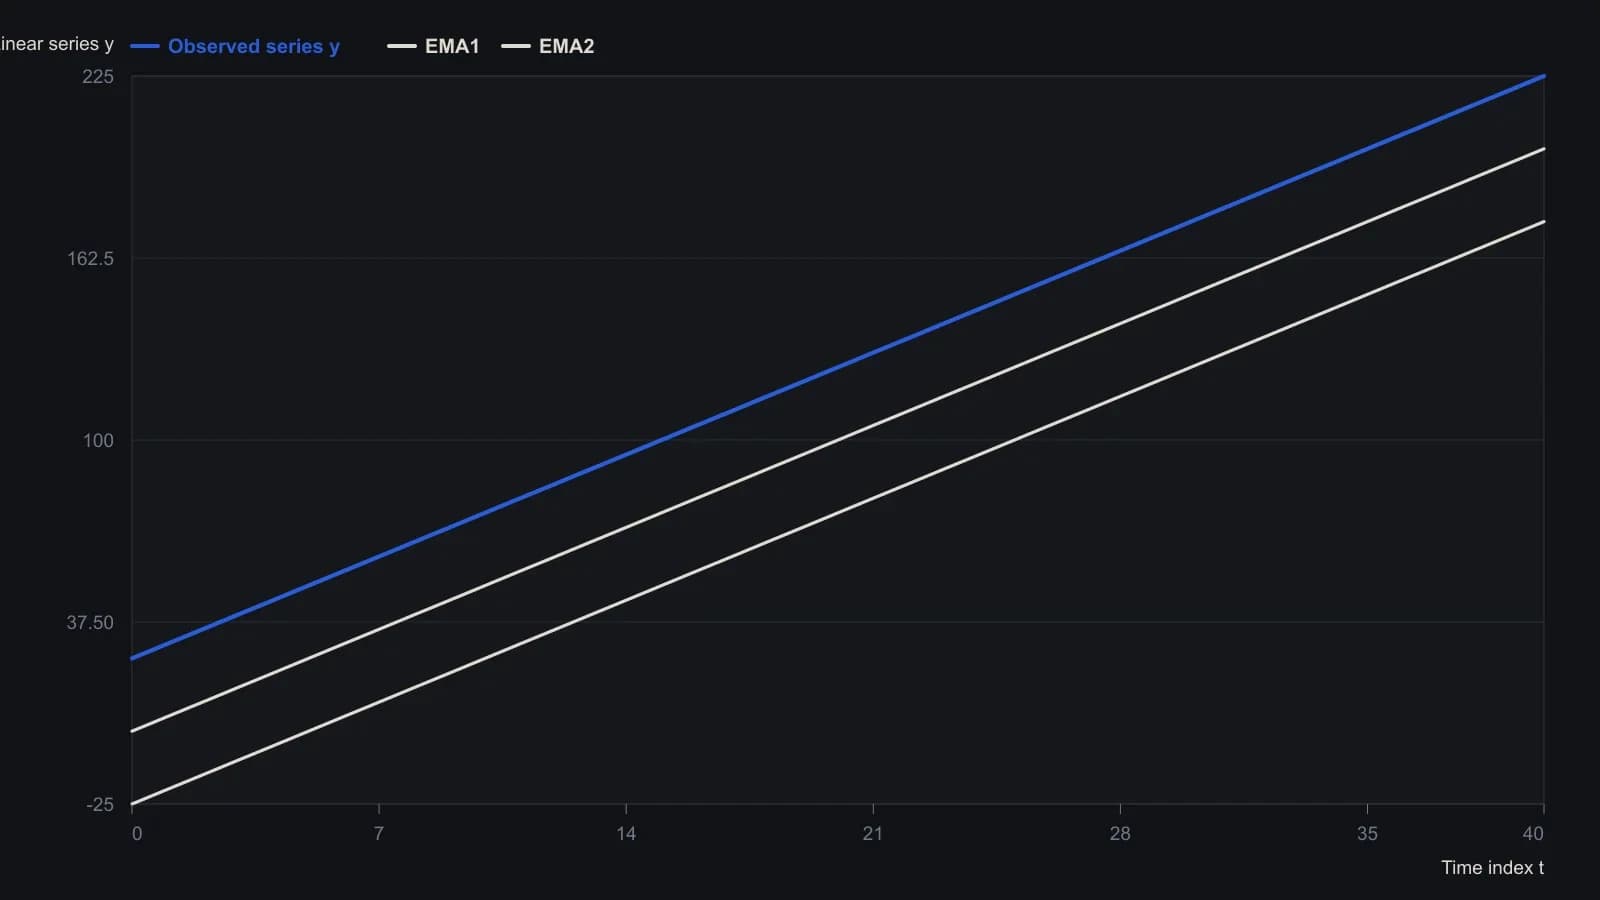
The sidebar assumes no noise and i > w. Window w = 11 so α = 2/(w+1) = 1/6 and lag L = (w−1)/2 = 5. Formal seeds are EMA1 at t = 0 ≈ 0 and EMA2 at t = 0 = −25, from intercept a = 25 and slope b = 5. Under those seeds EMA1(t) = 5t and EMA2(t) = 5t − 25 exactly, so DEMA1 = 2·EMA1 − EMA2 coincides with y.
All readings on this track · 43 readings
- 1990Constructing dollar baselines from rates, inflation, and residuals
- 1990Constructing a nominal index value from forward earnings and fitted yield
- 1990Constructing a nominal index price from earnings and a fitted yield
- 1990Endpoint-pinned price paths are not forecasts
- 1990Constructing least-squares polynomial smoothers
- 1991Endpoint growth rates versus linear-regression consistency
- 1991Out-of-sample checks for linear growth fits
- 1991Trend as persistence, not a straight line
- 1991Quadratic trend, residual oscillator, and a secondary cycle calendar
- 1991Time-origin offset and residual-price divergence on a quadratic least-squares fit
- 1991A least-squares trendline from ordered prices
- 1992Constructing log-linear growth and reliability screens
- 1992Constructing log-linear growth-rate baselines
- 1992Next-session high, low, and close from rolling linear regression
- 1993Auditing an index price-earnings multiple with short-rate regression
- 1994Regression-seeded nested exponential price filter
- 1994Constructing the double exponential average from lag cancellation
- 1994Evaluating money supply as a linear leading-index baseline
- 1995Constructing least-squares trend channels
- 1995Linear baseline holdout checks for annual bill-rate forecasts
- 1995Projection bands from high and low regression slopes
- 1995Evaluating a least-squares end-point moving average on a known test series
- 1996Constructing an endpoint moving average from a least-squares line
- 1996Scoring equity path consistency with a k-ratio overlay
- 1996Evaluating month-end yield gaps for equity regimes
- 1996Constructing session-indexed standard error bands
- 1998Evaluating linear regression baselines for index valuation
- 1998R-squared as a two-state trend filter from a price-time fit
- 2000Second-order moving-average lag correction
- 2002Price regression line versus beta for index tracking
- 2003Regression slope with an r-squared trend confidence gate
- 2003Constructing finite-volume-element divergence with slope comparison
- 2004Building a daily score from regression, retracement, and volume
- 2004Constructing least-squares trendlines from ordered prices
- 2007Rectangle breakout targets beyond height
- 2007Confirming a price trend with regression slope and r-squared
- 2008A linear-regression angle assembled as one trend filter
- 2010A two-state swing machine from four running extremes
- 2016Score oil-complex tightness before divergence or regression
- 2017Nikkei-yen intermarket divergence as a regime case study
- 2017Constructing Calmar ratio and linear regression baselines
- 2019Pair-trade layer construction versus average-spread management
- 2020A convolution slope built from nested linear regression