2007issue C061-7
Rectangle breakout targets beyond height
A rectangle is sideways price action between two horizontal or nearly horizontal parallel lines. In a 100-formation 2004-05 sample, breakout size tracked rectangle height more closely than the classical one-height objective, and a through-origin linear regression set breakout equal to 1.75 times height.
- A rectangle is sideways price action bounded by two horizontal or nearly horizontal parallel lines, typically defined by at least two points on each line and more often by three.
- In a 100-formation 2004-05 sample, rectangles were more often continuations than reversals, about 61% to 39%, or roughly 1.5 to 1.
- Breakout size correlated strongly with rectangle height and historical volatility, but only weakly with formation duration.
- A points-based linear regression of breakout on height produced r-squared 0.71; forcing the line through the origin gave breakout equal to 1.75 times height with r-squared 0.60, versus the classical one-height objective.
Confirm the sideways structure
A rectangle is sideways price action bounded by two horizontal or nearly horizontal parallel lines, typically defined by at least two points on each line and more often by three.
Continuation, reversal, and time to complete
In a 100-formation 2004-05 sample, rectangles were more often continuations than reversals, about 61% to 39%, or roughly 1.5 to 1.
Reversal rectangles completed faster on average than continuation rectangles, 152 days versus 218 days.
Volume inside the rectangle and at the breakout
Volume during the formation averaged 90% of usual activity, while upside-breakout volume commonly rose to about two to three times rectangle-period volume.
Height-based forecasts after breakout confirmation
Breakout size correlated strongly with rectangle height (Spearman rho 0.66) and with historical volatility (0.62), but only weakly with formation duration (0.09).
A points-based linear regression of breakout on height produced r-squared 0.71; forcing the line through the origin gave Breakout = 1.75 times height with r-squared 0.60, versus the classical one-height objective.
Height-based forecasts versus actual rectangle breakout highs
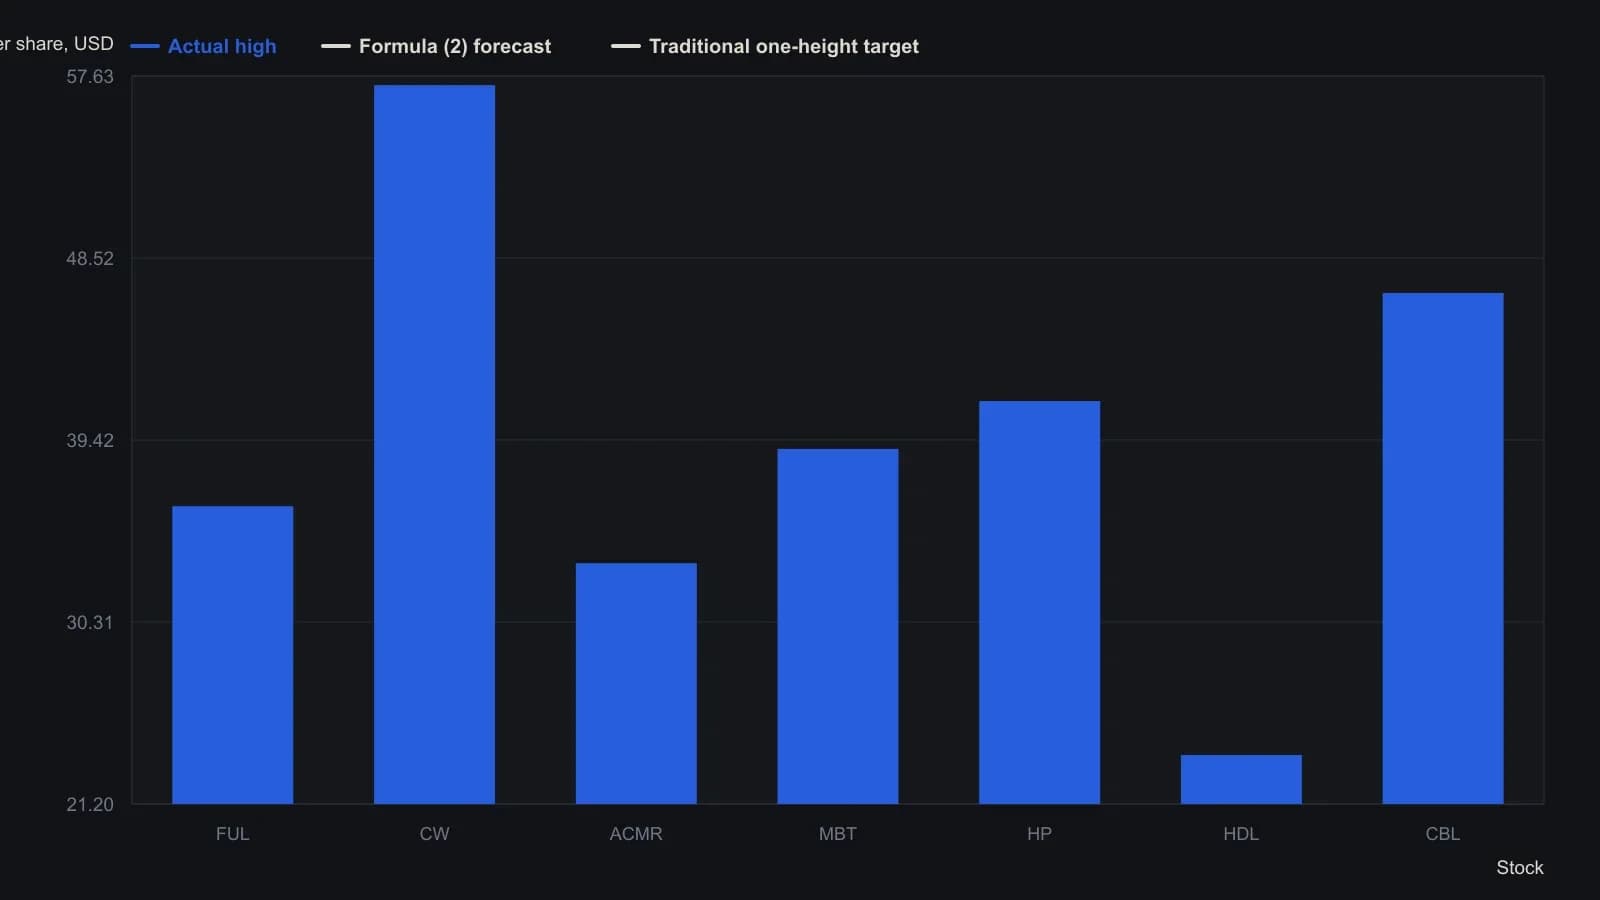
Predicted price uses formula (2), breakout = 2.3 times height to the 0.8, added to the upper boundary. The traditional column adds one rectangle height. The source notes that FUL, CW, and HP later split 2-for-1 and these unadjusted rows were left as published.
All readings on this track · 43 readings
- 1990Constructing dollar baselines from rates, inflation, and residuals
- 1990Constructing a nominal index value from forward earnings and fitted yield
- 1990Constructing a nominal index price from earnings and a fitted yield
- 1990Endpoint-pinned price paths are not forecasts
- 1990Constructing least-squares polynomial smoothers
- 1991Endpoint growth rates versus linear-regression consistency
- 1991Out-of-sample checks for linear growth fits
- 1991Trend as persistence, not a straight line
- 1991Quadratic trend, residual oscillator, and a secondary cycle calendar
- 1991Time-origin offset and residual-price divergence on a quadratic least-squares fit
- 1991A least-squares trendline from ordered prices
- 1992Constructing log-linear growth and reliability screens
- 1992Constructing log-linear growth-rate baselines
- 1992Next-session high, low, and close from rolling linear regression
- 1993Auditing an index price-earnings multiple with short-rate regression
- 1994Regression-seeded nested exponential price filter
- 1994Constructing the double exponential average from lag cancellation
- 1994Evaluating money supply as a linear leading-index baseline
- 1995Constructing least-squares trend channels
- 1995Linear baseline holdout checks for annual bill-rate forecasts
- 1995Projection bands from high and low regression slopes
- 1995Evaluating a least-squares end-point moving average on a known test series
- 1996Constructing an endpoint moving average from a least-squares line
- 1996Scoring equity path consistency with a k-ratio overlay
- 1996Evaluating month-end yield gaps for equity regimes
- 1996Constructing session-indexed standard error bands
- 1998Evaluating linear regression baselines for index valuation
- 1998R-squared as a two-state trend filter from a price-time fit
- 2000Second-order moving-average lag correction
- 2002Price regression line versus beta for index tracking
- 2003Regression slope with an r-squared trend confidence gate
- 2003Constructing finite-volume-element divergence with slope comparison
- 2004Building a daily score from regression, retracement, and volume
- 2004Constructing least-squares trendlines from ordered prices
- 2007Rectangle breakout targets beyond height
- 2007Confirming a price trend with regression slope and r-squared
- 2008A linear-regression angle assembled as one trend filter
- 2010A two-state swing machine from four running extremes
- 2016Score oil-complex tightness before divergence or regression
- 2017Nikkei-yen intermarket divergence as a regime case study
- 2017Constructing Calmar ratio and linear regression baselines
- 2019Pair-trade layer construction versus average-spread management
- 2020A convolution slope built from nested linear regression